What Is the Difference Between Causation and Correlation?
Correlation is a statistical relationship between two variables such that changes in one are associated with predictable changes in the other - but this association carries no information about whether one variable produces the other.
Causation, by contrast, describes a mechanism: a change in one variable directly brings about a change in another, holding all else equal.
The distinction is foundational to empirical reasoning because correlated variables may share a common cause, may be related by coincidence, or may exhibit reverse causality, none of which support the interventions that true causal relationships would justify.
In 2012, researchers published a study showing a strong correlation between countries' chocolate consumption per capita and their number of Nobel Prize winners. Switzerland, with high chocolate consumption, had many Nobel laureates. Countries with low chocolate consumption had fewer.
The correlation was striking and statistically significant.
Does this mean eating chocolate causes Nobel Prize-winning brilliance? Should governments subsidize chocolate consumption to boost scientific achievement?
Obviously not. The correlation exists, but causation doesn't. The likely explanation: wealth. Wealthy countries can afford both high-quality chocolate and well-funded research universities that produce Nobel laureates.
Chocolate consumption and Nobel prizes are both effects of a common cause (national wealth), not causally related to each other.
This example, popularized by Franz Messerli's tongue-in-cheek paper, illustrates one of the most important, and most commonly violated, principles in data analysis, scientific reasoning, and critical thinking: correlation does not imply causation.
Understanding this distinction is not academic pedantry, it's essential for making good decisions. Interventions based on correlation without causation waste resources and fail to achieve goals.
Medical treatments, business strategies, public policies, and personal decisions all hinge on understanding what actually causes what, not just what correlates with what.
This article explains the difference between correlation and causation comprehensively: what each means, why they're easily confused, how to establish causation rigorously, common patterns of mistaken causal inference, and practical approaches to thinking causally in a world full of correlational data.
Defining the Terms: Correlation and Causation
Before exploring their relationship, we need precise definitions.
Correlation: Variables Moving Together
Correlation describes a statistical relationship between two variables, when one changes, the other tends to change in a predictable way.
Types of correlation:
| Type | Description | Example |
|---|---|---|
| Positive correlation | As X increases, Y tends to increase | Height and weight |
| Negative correlation | As X increases, Y tends to decrease | Exercise and resting heart rate |
| No correlation | X and Y vary independently | Shoe size and intelligence (in adults) |
Strength ranges from weak (noisy, inconsistent relationship) to strong (tight, consistent relationship).
Importantly: Correlation is symmetric, if X correlates with Y, then Y correlates with X. The statistic doesn't tell you direction.
What correlation tells you: Two variables co-vary. Something connects them.
What correlation doesn't tell you: Which causes which, if either does. Whether a third factor causes both. Whether the relationship is causal at all.
Causation: One Thing Producing Another
Causation means one variable (the cause) directly produces changes in another variable (the effect) through some mechanism.
Key features of causation:
- Asymmetric: If X causes Y, Y doesn't necessarily cause X
- Mechanistic: There's a physical, biological, social, or economic process by which cause produces effect
- Interventional: Changing the cause changes the effect
- Temporal: Cause precedes effect in time
Example: Smoking causes lung cancer.
- Asymmetric: Lung cancer doesn't cause smoking
- Mechanistic: Carcinogens in smoke damage lung tissue DNA
- Interventional: Quitting smoking reduces lung cancer risk
- Temporal: Years of smoking precede cancer diagnosis
What causation tells you: Intervention on X will change Y. Understanding mechanisms. Ability to predict effects of actions.
Why Correlation ≠ Causation: The Fundamental Problem
Correlation can arise from several relationships, only one of which is causation.
Scenario 1: X Causes Y (True Causation)
Example: Vaccination causes reduced disease incidence.
Correlation exists: vaccinated populations have lower disease rates. Causation also exists: vaccines produce immunity through biological mechanism.
This is the goal: finding correlations that reflect genuine causation.
Scenario 2: Y Causes X (Reverse Causation)
Example: Correlation between hospitalizations and mortality.
Naive interpretation: Hospitals cause death (people die in hospitals).
Reality: Serious illness causes both hospitalization and death. Causation runs from illness → hospitalization, not hospitalization → death.
Why this matters: If you interpreted correlation as causation, you'd close hospitals to reduce deaths.
Scenario 3: Z Causes Both X and Y (Common Cause/Confounding)
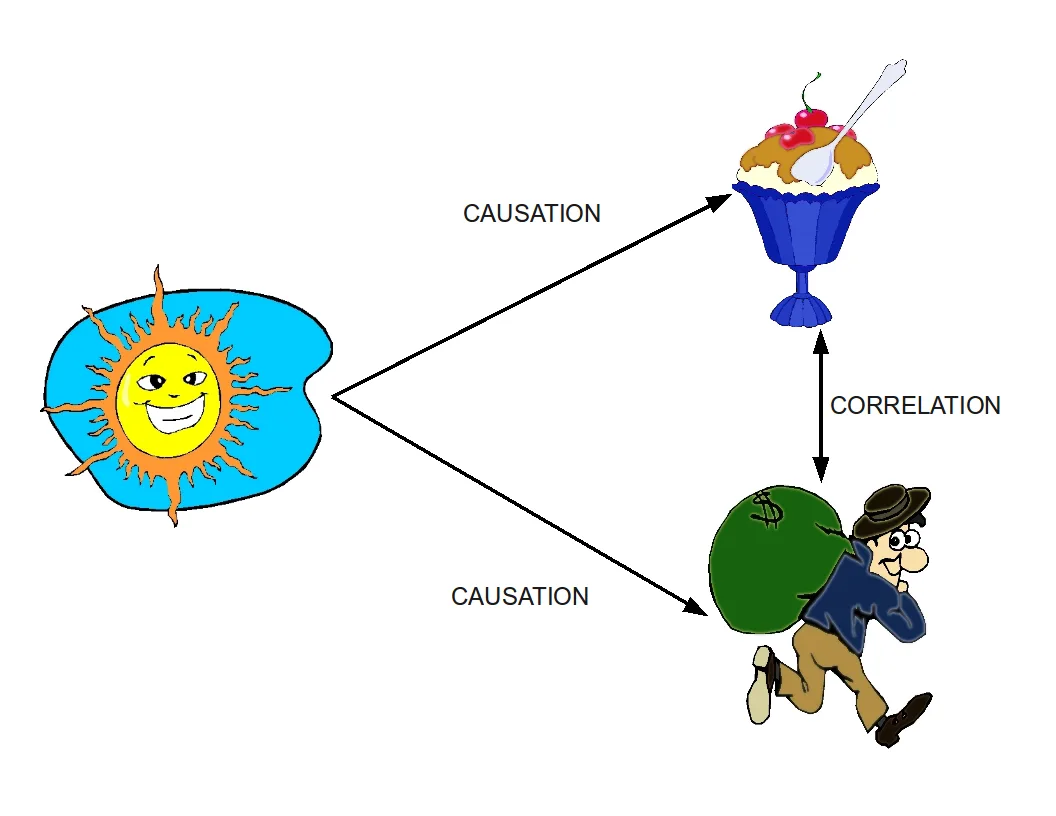
Example: Ice cream sales (X) and drowning deaths (Y).
Strong positive correlation: when ice cream sales rise, drownings increase.
Does ice cream cause drowning? No.
Common cause (Z): Summer weather. Hot weather increases both ice cream purchases and swimming, which increases drowning exposure.
This is confounding: a third variable (confounder) creates spurious correlation between X and Y.
Scenario 4: Coincidence (Spurious Correlation)
Example: Nicolas Cage movie releases correlate with swimming pool drownings.
No plausible causal mechanism. No common cause. Just random chance in a world with billions of measurable variables, some will correlate by coincidence.
Tyler Vigen's website "Spurious Correlations" catalogs hundreds: divorce rate in Maine correlates with per capita margarine consumption, US crude oil imports correlate with chicken consumption, etc.
Why this happens: With enough variables, some will correlate by pure chance. This is the multiple comparisons problem.
Scenario 5: Complex Causal Networks
Example: Education level correlates with income.
Causal relationships:
- Education → Skills → Income (education causes income)
- Family wealth → Education access AND → Network/opportunities → Income (common cause)
- High intelligence → Educational success AND → Job performance → Income (common cause)
- Income → Ability to afford continuing education → More credentials (reverse causation)
Reality involves multiple causal paths, not simple X causes Y.
Why People Confuse Correlation with Causation
Understanding the psychology behind this error helps avoid it.
Reason 1: Pattern-Seeking Brains
Human brains evolved to detect patterns and infer causes quickly. Psychologist Daniel Kahneman describes this as System 1 thinking: fast, automatic, intuitive.
Evolutionary benefit: Ancestors who saw rustling grass, inferred "predator," and fled survived better than those who waited for proof.
Modern cost: We infer causation from correlation reflexively, even when wrong.
The broader mechanisms behind cognitive biases like this one help explain many poor decisions made with otherwise reliable data.
Reason 2: Narrative Fallacy
Humans construct causal stories to make sense of correlations. Nassim Taleb calls this the narrative fallacy: imposing clean causal explanations on messy data.
Example: Stock market rose after election → election caused rise. (Ignores countless other factors; confuses correlation with causation; creates false confidence in prediction.)
"The human mind does not simply register what it observes. It constructs stories to make sense of the data." - Daniel Kahneman
Reason 3: Temporal Precedence Illusion
When A happens before B, we intuitively feel A caused B.
Example: Child receives vaccine, then is diagnosed with autism. Timing suggests causation.
Reality: Autism diagnosis typically occurs 12-24 months, coinciding with vaccination schedule. Correlation from timing, not causation. Extensive research found no causal link.
Reason 4: Confirmation Bias
We notice and remember correlations that support our existing beliefs while dismissing contradictory evidence.
Example: Believing "cracking knuckles causes arthritis," you notice people with both. You don't notice (or discount) people who crack knuckles without arthritis or arthritis sufferers who never cracked knuckles.
Reason 5: Media and Communication
Headlines often report correlation as causation for impact:
- Reported: "Coffee Linked to Lower Heart Disease Risk"
- Interpreted by readers: Coffee prevents heart disease
- Reality: Observational study found correlation; confounding by lifestyle factors likely; causation unestablished
Causal language is simpler, more compelling, more clickable than accurate correlational language.
Reason 6: Statistical Illiteracy
Many people lack training in statistics and research methods. Without understanding confounding, reverse causation, and causal inference techniques, correlation feels like evidence of causation.
Establishing Causation: The Bradford Hill Criteria
Epidemiologist Austin Bradford Hill proposed criteria for inferring causation from observational data. Not checklist, guidelines for evaluating causal claims.
1. Temporal Precedence
Cause must precede effect in time.
If A causes B, A must occur before B. If A happens after B, A can't cause B.
Example: Smoking must precede lung cancer diagnosis. (It does, decades of smoking before cancer emerges.)
Limitation: Precedence is necessary but not sufficient. Many non-causal factors precede effects (astrology sign precedes life events, doesn't cause them).
2. Strength of Association
Strong correlations more likely causal than weak ones.
Weak correlations could easily arise from confounding or chance. Very strong correlations (relative risk >10) more likely reflect causation.
Example: Smoking increases lung cancer risk ~20-fold (very strong). Such dramatic association unlikely explained by confounding alone.
Limitation: Weak associations can be causal if effect is real but small; strong associations can be non-causal if confounding is strong.
3. Dose-Response Relationship
More exposure → larger effect.
If causal, increasing dose should increase effect magnitude.
Example: Heavy smokers have higher cancer rates than light smokers. Pack-years (cigarettes per day × years) show dose-response gradient.
Limitation: Some causes have threshold effects (no effect until threshold, then effect) or saturation effects (effect plateaus).
4. Consistency Across Studies
Relationship observed in multiple studies, populations, settings.
If relationship is causal, it should replicate. If it's spurious or confounded, it likely won't consistently replicate.
Example: Hundreds of studies across decades, countries, and populations found smoking-cancer link.
Limitation: Consistent confounding (if confounder present in all studies) can produce consistent non-causal correlations.
5. Plausibility (Biological/Physical Mechanism)
There's a scientifically plausible mechanism explaining how cause produces effect.
Understanding mechanism strengthens causal claim.
Example: Carcinogens in tobacco smoke damage DNA → mutations → cancer. Mechanism is well-understood.
Limitation: Mechanism might be unknown when causation is genuine (smoking-cancer link observed before mechanism fully understood). Also, plausible mechanism can be wrong.
6. Coherence with Existing Knowledge
Causal claim consistent with what's known in related fields.
Example: Smoking-cancer link coherent with toxicology (tobacco contains carcinogens), pathology (lung tissue damage in smokers), animal studies (tobacco exposure causes cancer in animals).
Limitation: Revolutionary discoveries may initially appear incoherent with existing knowledge.
7. Experiment (Intervention)
Manipulating cause changes effect. Gold standard for causation.
Randomized Controlled Trials (RCTs): Randomly assign treatment/control, measure outcomes. Randomization eliminates confounding.
Example: Can't ethically test smoking-cancer link in humans via RCT (can't force people to smoke). But can test smoking cessation interventions, quitting reduces cancer risk, supporting causal claim.
Limitation: Many causal questions can't be tested experimentally for ethical or practical reasons.
8. Specificity
Specific cause produces specific effect.
Example: Asbestos exposure specifically increases mesothelioma (rare cancer). Specificity strengthens causal inference.
Limitation: Most causes produce multiple effects; most effects have multiple causes. Lack of specificity doesn't rule out causation.
9. Analogy
Similar causes produce similar effects.
If chemically similar compound A causes effect X, compound B (similar to A) causing effect Y (similar to X) is more plausible.
Limitation: Analogies can mislead if dissimilarities are crucial.
Methods for Establishing Causation
Beyond Hill criteria, specific research designs enable causal inference.
Randomized Controlled Trials (RCTs)
Gold standard: Randomly assign participants to treatment or control. Measure outcomes.
Why it works: Randomization ensures treatment and control groups are statistically equivalent at baseline. Any difference in outcomes is caused by treatment (assuming proper implementation).
Example: Testing new drug, randomly assign half to drug, half to placebo. If drug group improves more, drug caused improvement.
Limitations:
- Expensive and time-consuming
- Unethical for harmful exposures (can't randomly assign smoking)
- May not generalize beyond study population
- Can't study long-term effects or rare outcomes feasibly
Natural Experiments
Observational studies where treatment assignment approximates randomization due to circumstances.
Example: John Snow's cholera investigation. London neighborhoods got water from different sources (somewhat random). Snow compared cholera rates by water source, found Broad Street pump contaminated. Removing pump handle stopped outbreak. Natural experiment supported causal claim that contaminated water caused cholera.
Modern example: Regression discontinuity designs. Policy applies at cutoff (e.g., everyone over age 65 eligible for Medicare). People just above and below cutoff similar except for policy. Comparing outcomes approximates experiment.
Limitation: "Natural" assignment rarely truly random, requires careful analysis to ensure comparability.
Instrumental Variables
Statistical technique using "instruments", variables affecting treatment but not outcome except through treatment.
Example: Draft lottery during Vietnam War. Lottery number (instrument) affected military service but not outcomes like earnings except through service. Comparing outcomes by lottery number estimates causal effect of military service.
Limitation: Finding valid instruments is difficult; assumptions often debatable.
Longitudinal Studies and Time-Series Analysis
Repeatedly measure variables over time. Establish temporal ordering. Control for time trends.
Example: Measuring air pollution and health outcomes over years. Can establish pollution changes precede health changes, controlling for seasonal patterns and trends.
Limitation: Still observational, confounding possible. Causation stronger with multiple lines of evidence.
Counterfactual Reasoning
Ask: What would have happened without the cause?
If you can estimate counterfactual (what would have occurred absent treatment), you can estimate causal effect (difference between actual outcome and counterfactual).
Techniques: Matching, propensity scores, difference-in-differences, synthetic controls.
Example: Company implements new sales training. Compare sales after training to matched control group (similar companies/salespeople without training). Difference estimates causal effect.
Limitation: Relies on unverifiable assumptions about comparability.
Common Causal Fallacies and How to Avoid Them
Fallacy 1: Post Hoc Ergo Propter Hoc
"After this, therefore because of this."
Assuming A caused B simply because A preceded B.
Example: Rooster crows before sunrise → rooster causes sunrise.
Avoidance: Temporal precedence is necessary but not sufficient. Always ask: Is there a plausible mechanism? Could both be effects of a common cause?
Fallacy 2: Cum Hoc Ergo Propter Hoc
"With this, therefore because of this."
Assuming correlation implies causation without considering alternatives.
Example: Countries with more fire trucks have more fires → fire trucks cause fires.
Reality: Population size causes both (bigger cities have more fires and more fire trucks).
Avoidance: For any correlation, systematically consider: reverse causation, common cause, coincidence.
Fallacy 3: Ignoring Confounders
Failing to account for variables affecting both cause and effect.
Example: Correlation between coffee and heart disease, ignoring that coffee drinkers (historically) more likely to smoke, and smoking causes heart disease.
Avoidance: Think hard about what other variables might matter. Measure and control for them. Randomized trials eliminate confounding.
"Correlation does not imply causation, but it does waggle its eyebrows suggestively and gesture furtively." - Randall Munroe
Fallacy 4: Selection Bias
Studying non-representative sample creates spurious correlations.
Example: Studying hospitalized patients, finding correlation between treatment X and poor outcomes. But patients receiving X were sicker to begin with (doctors give X to severe cases). Confounding by indication.
Avoidance: Ensure comparison groups are truly comparable. Use random assignment or strong matching methods.
Fallacy 5: Regression to the Mean
Extreme values tend to be followed by less extreme values, creating illusion of causation.
Example: Athletes have unusually good season, get featured on magazine cover, then perform worse next season. "Cover curse", or regression to mean?
Reality: Outlier performance partly luck. Next season closer to true ability. No curse needed.
Avoidance: Recognize that extremes are often partly random. Control for baseline when measuring change.
Communicating About Correlation and Causation
How you talk about relationships matters enormously.
Language Matters
Correlational language (appropriate for observational data):
- "X is associated with Y"
- "X correlates with Y"
- "X is linked to Y"
- "X predicts Y"
- "Higher X related to higher Y"
Causal language (appropriate only with strong evidence):
- "X causes Y"
- "X leads to Y"
- "X increases/decreases Y"
- "X produces Y"
- "X results in Y"
Example:
Bad: "Study shows coffee causes weight loss"Good: "Study finds association between coffee consumption and weight loss; causation not established"
Acknowledging Uncertainty
Strong communication includes:
- Limitations: "This study is observational, so we can't rule out confounding"
- Alternative explanations: "This correlation could reflect reverse causation or common causes"
- Need for further research: "Randomized trials needed to establish causation"
- Effect size and confidence: "Small effect with wide confidence interval"
Avoiding Hype
Sensational causal claims from weak evidence damage public understanding and trust.
Responsible scientists: Qualify claims, acknowledge limitations, emphasize preliminary nature.
Irresponsible media: Strip nuance, headline causal claims, ignore limitations.
Example:
Study: Observational data shows people who eat nuts have lower cardiovascular disease risk.
Responsible: "Nut consumption associated with lower heart disease risk in observational study. Possible confounders include overall diet quality and health consciousness. Clinical trials needed."
Irresponsible: "Eat Nuts to Prevent Heart Disease, Study Shows"
Practical Guidelines for Causal Thinking
For Data Analysis
1. Start with clear causal question: What specific causal relationship are you investigating?
2. Map potential confounders: What else could explain correlation?
3. Check temporal ordering: Does proposed cause precede effect?
4. Look for dose-response: Does more cause produce more effect?
5. Consider mechanism: How would cause produce effect?
6. Seek experimental or quasi-experimental evidence: Can you approximate randomization?
7. Triangulate: Multiple lines of evidence converging?
For Consuming Research
1. Distinguish study type: RCT? Observational? Survey?
2. Check for causal language: Do authors claim causation? Is it warranted?
3. Look for confounders: Did study measure and control important confounders?
4. Assess generalizability: Does sample match population you care about?
5. Look for replication: Is this one study or consensus across many?
6. Consider incentives: Do researchers/funders have stake in particular outcome?
7. Read methods and limitations: Often most informative sections.
For Decision-Making
1. Require causal evidence for causal interventions: If you're changing X to affect Y, need evidence X causes Y.
2. Be skeptical of single studies: Wait for replication and convergence.
3. Consider opportunity cost: Resources spent on non-causal interventions are wasted.
4. Accept uncertainty: Sometimes causal evidence is weak but decision still required. Make best judgment with available evidence, but remain open to updating.
5. Look for mechanisms: Understanding how something works provides confidence in causation and ability to generalize.
The same rigor applied to causal thinking applies broadly to data-driven decision making, understanding what data can and cannot tell you is foundational to using it well.
Conclusion: Correlation is Common, Causation is Rare
In a world of big data, correlations are everywhere. With millions of measurable variables, astronomical numbers of correlations exist, most meaningless. Causation, by contrast, is comparatively rare and requires rigorous evidence to establish.
The key insights:
1. Correlation ≠ causation, but correlation ⊃ causation: All causal relationships produce correlation, but most correlations aren't causal. Correlation is a necessary but not sufficient condition for causation.
2. Multiple mechanisms produce correlation: True causation, reverse causation, common causes (confounding), coincidence, and complex causal networks. Always ask which applies.
3. Humans are biased toward causal thinking: Evolution wired us to see patterns and infer causes quickly. This serves us in some contexts but leads to systematic errors in complex modern environments.
4. Bradford Hill criteria provide framework: Temporal precedence, strength, dose-response, consistency, plausibility, coherence, experimental evidence, specificity. No single criterion is definitive; weigh evidence holistically.
5. Randomized experiments are gold standard: When ethical and feasible, RCTs provide strongest causal evidence by eliminating confounding through randomization.
6. Observational data can suggest causation: With careful design, statistical techniques, and multiple converging lines of evidence, observational studies can establish causation, but standards are high.
7. Language and communication matter: Precision in distinguishing correlational from causal claims prevents misunderstanding and poor decisions.
As statistician George Box famously said: "All models are wrong, but some are useful." Similarly: All causal claims from observational data are uncertain, but some are well-supported.
The goal isn't perfect certainty, it's proportioning confidence to evidence, thinking clearly about mechanisms, and making decisions based on best available understanding while remaining open to revision.
Chocolate consumption doesn't cause Nobel Prizes. But rigorous causal thinking, understanding what truly causes what, might help you win one.
Sources & Further Reading
- Bradford Hill, A. "The Environment and Disease: Association or Causation?" Proceedings of the Royal Society of Medicine, 1965.
- Hernán, M. A., and Robins, J. M. "Causal Inference: What If." Chapman & Hall/CRC, 2020.
- Imbens, G. W., and Rubin, D. B. "Causal Inference for Statistics, Social, and Biomedical Sciences." Cambridge University Press, 2015.
- Kahneman, D. "Thinking, Fast and Slow." Farrar, Straus and Giroux, 2011.
- Messerli, F. H. "Chocolate Consumption, Cognitive Function, and Nobel Laureates." New England Journal of Medicine, 2012.
- Pearl, J., and Mackenzie, D. "The Book of Why: The New Science of Cause and Effect." Basic Books, 2018.
- Rohrer, J. M. "Thinking Clearly About Correlations and Causation: Graphical Causal Models for Observational Data." Advances in Methods and Practices in Psychological Science, 2018.
- Shadish, W. R., Cook, T. D., and Campbell, D. T. "Experimental and Quasi-Experimental Designs for Generalized Causal Inference." Houghton Mifflin, 2002.
- Taleb, N. N. "The Black Swan: The Impact of the Highly Improbable." Random House, 2007.
- Vigen, T. "Spurious Correlations." Hachette Books, 2015.
Landmark Research That Established Causal Inference Methods
The modern scientific toolkit for distinguishing causation from correlation was built primarily between the 1960s and 1990s, through a series of methodological breakthroughs that are now standard in economics, epidemiology, and increasingly in business analytics.
The Framingham Heart Study and Long-Term Causal Evidence. The Framingham Heart Study, launched in 1948 by the National Heart, Lung, and Blood Institute, is among the most consequential longitudinal studies in medical history.
By following 5,209 adults in Framingham, Massachusetts over decades-and later their children and grandchildren-the study established causal links between specific risk factors and cardiovascular disease that could not have been identified from cross-sectional observational data alone.
The landmark 1961 findings by William Kannel and colleagues, published in the Annals of Internal Medicine, established that high blood cholesterol, high blood pressure, and cigarette smoking were independent causal risk factors for coronary heart disease.
The study's methodology-repeated measurements of the same individuals over time, combined with careful tracking of incident disease-enabled temporal precedence to be established in a way no single-point-in-time study could.
The Framingham study remains a model for distinguishing association from causation in epidemiological research. By its 75th anniversary, the study had produced over 3,000 peer-reviewed publications, many of which revised earlier causal claims as longer follow-up periods changed the picture-illustrating that causal inference is iterative, not final.
Joshua Angrist and the Draft Lottery: Instrumental Variables in Practice. Economist Joshua Angrist, who won the Nobel Prize in Economic Sciences in 2021 (with David Card and Guido Imbens) for his work on causal inference from natural experiments, published his foundational 1990 paper "Lifetime Earnings and the Vietnam Era Draft Lottery" in the American Economic Review.
Angrist used the random assignment of draft lottery numbers during the Vietnam War as an instrumental variable to estimate the causal effect of military service on earnings.
Because lottery numbers were randomly assigned, men with high lottery numbers (eligible for the draft) were otherwise comparable to men with low lottery numbers (ineligible), allowing differences in outcomes to be attributed to military service itself rather than to selection effects-men who volunteered for service might be systematically different from those who did not.
Angrist found that white veterans earned approximately 15 percent less than non-veterans with comparable lottery numbers in the decade following service.
The causal effect was negative and significant. Purely observational studies comparing veterans to non-veterans produced different estimates because selection effects (men who volunteered being different from men who did not) contaminated the comparison.
The methodology Angrist demonstrated has since been applied to studying the causal effects of education policy, health insurance coverage, immigration, and dozens of other policy-relevant questions.
The Nurse's Health Study and the Hormone Therapy Reversal. The Nurses' Health Study, begun by Frank Speizer at Harvard in 1976 and subsequently led by Walter Willett, followed 121,700 female nurses and became one of the largest investigations of risk factors for chronic diseases in women.
Observational analyses from the study consistently found that postmenopausal women who took hormone replacement therapy (HRT) had lower rates of coronary heart disease than women who did not.
For decades, this correlation was interpreted as causal, and HRT was widely prescribed partly for heart disease prevention.
The Women's Health Initiative, a randomized controlled trial published in JAMA in 2002 by Jacques Rossouw and colleagues, tested HRT against placebo and found the opposite: HRT increased the risk of coronary heart disease, stroke, and breast cancer.
The observational studies had been confounded by the "healthy user bias"-women who chose to take HRT were, on average, more health-conscious, of higher socioeconomic status, and more engaged with preventive care.
These confounders created the illusion of a cardiac benefit that the randomized experiment revealed did not exist. The HRT reversal is now a standard teaching case in epidemiology and a cautionary example of how strong observational correlations can systematically mislead when confounding is systematically present across studies.
Applied Case Studies: Causal Reasoning in Business Decisions
Marketplace Pricing and the Demand Confound. Two-sided marketplaces like Airbnb regularly face a textbook causation-versus-correlation challenge when analyzing the relationship between listing prices and booking rates. Observational data often shows that higher-priced listings have higher occupancy in certain markets and time periods.
A naive causal interpretation-that higher prices cause higher bookings-would obviously be wrong, but it reflects a real confounding structure: in markets with high demand (major events, holidays, popular locations), hosts raise prices and receive more bookings for the same underlying reason. Demand is the common cause driving both price and occupancy.
Marketplaces that build dynamic pricing tools have to design around exactly this confound: any pricing recommendation system needs to separate the causal effect of price itself from the demand conditions that happen to correlate with both price and bookings, typically through some form of randomized experimentation on the pricing recommendations shown to sellers rather than by reading observational price-occupancy correlations at face value.
Walmart's Hurricane Preparation Analysis. In 2004, Walmart's analytics team conducted a naturalistic study of what products sold in the days before hurricanes in Florida and North Carolina.
The correlation-driven finding-that strawberry Pop-Tarts sold at seven times their normal rate in the days before a major storm-was genuinely useful for inventory pre-positioning, even without a clear causal mechanism.
The case, described by former Walmart CIO Linda Dillman in multiple interviews and reported by The New York Times in 2004, illustrates a situation where correlation without causation is still actionable for prediction purposes.
Pre-hurricane shopping correlated with increased Pop-Tart sales; Walmart could stock more Pop-Tarts before predicted storms and increase revenue.
What the correlation could not tell Walmart was whether to promote Pop-Tarts as hurricane supplies (attempting to use the correlation causally) or simply to stock them in anticipation of demand that would arise for other reasons.
The practical lesson: correlations are useful for prediction even when causal mechanisms are unknown, but interventions based on those correlations require causal understanding to be effective.
Facebook's Advertising Attribution Crisis. In 2016, a paper by economists Brett Gordon, Florian Zettelmeyer, Neha Bhargava, and Dan Chapsky-conducted in partnership with Facebook-examined the causal effect of Facebook advertising on purchase behavior.
The study found that standard observational attribution methods substantially overstated advertising effectiveness because people who see and click on Facebook ads are not randomly selected from the advertising audience.
Ad-clickers are more engaged, more interested in the product category, and more likely to purchase regardless of the ad. Comparing purchasers who were ad-exposed to those who were not-without accounting for this selection-attributes purchases to the ad that would have occurred anyway.
The study, published as a working paper and widely circulated among advertising economists, used randomized holdout groups (users who were shown public service announcements instead of brand ads) to establish the causal effect.
Results showed that observational estimates of ad effectiveness overstated the true causal impact by a factor of three or more. Facebook subsequently expanded its "conversion lift" measurement product, which uses randomized holdout groups to provide causal rather than correlational advertising attribution.
Word count: 5,139 words
Frequently Asked Questions
What is the difference between correlation and causation?
Correlation means two variables change together in a predictable pattern, when one increases, the other tends to increase (positive) or decrease (negative). Causation means one variable directly causes changes in another through a causal mechanism. Key difference: correlated variables may have no causal relationship, both could be caused by a third factor (confounding), the relationship could be coincidental, or causation could run opposite direction. Example: ice cream sales correlate with drowning deaths, but ice cream doesn’t cause drowning, both increase in summer (common cause). Understanding this distinction is critical because: interventions based on correlation without causation are ineffective, resources get wasted on non-causal relationships, and mistaking correlation for causation leads to wrong conclusions and poor decisions.
Why do people confuse correlation with causation?
People confuse them because: (1) Human brains seek patterns and causal stories, (2) Correlation feels like evidence of causation, (3) Temporal order creates causation illusion (A before B suggests A caused B), (4) Confirmation bias, we notice correlations supporting our beliefs, (5) Media reports correlations as causal relationships, (6) Complexity, real causes are often multifactorial and non-obvious, (7) Lack of statistical training, (8) Desire for simple explanations over complex reality. Evolutionary psychology: our ancestors survived by making quick causal inferences even when wrong (better to assume rustling grass is predator). Modern world requires more rigorous thinking, correlation is common, causation is rare and requires strong evidence.
What evidence is needed to establish causation?
Bradford Hill criteria for causation: (1) Temporal precedence, cause precedes effect, (2) Strength of association, strong correlation more likely causal, (3) Dose-response, more exposure, larger effect, (4) Consistency, relationship observed across studies, settings, populations, (5) Specificity, specific cause leads to specific effect, (6) Plausibility, biological/physical mechanism makes sense, (7) Coherence, consistent with existing knowledge, (8) Experiment, intervention changes outcome (gold standard), (9) Reversibility, removing cause eliminates effect. No single criterion is sufficient; strong causation meets multiple criteria. Randomized controlled trials (RCTs) are gold standard because randomization eliminates confounding. Observational studies can suggest causation but rarely prove it definitively without supporting evidence from multiple criteria.
What are common examples of mistaking correlation for causation?
Classic examples: (1) Ice cream sales and drowning deaths, both caused by summer weather, (2) Stork populations and birth rates, both correlate with urbanization, (3) Nicolas Cage movies and pool drownings, pure coincidence, (4) Shoe size and reading ability in children, both caused by age, (5) Coffee and cancer, confounded by smoking (coffee drinkers more likely to smoke), (6) Autism and vaccines, temporal coincidence not causation, (7) Chocolate consumption and Nobel prizes, wealth causes both, (8) Divorce rates and margarine consumption, spurious correlation. These illustrate: common causes, reverse causation, confounding variables, and pure coincidence. Always ask: could there be a third variable explaining both? Could causation run the other direction? Could this just be chance?
How do confounding variables hide true causal relationships?
Confounding occurs when third variable influences both supposed cause and effect, creating spurious correlation. Example: studying correlation between coffee and heart disease without accounting for smoking, coffee drinkers historically more likely to smoke, smoking causes heart disease, so coffee appears causal when it’s not. Confounders hide truth by: creating false correlations, obscuring true effects, reversing apparent directions of effects. Detection: (1) Think about what else could explain observed relationship, (2) Measure potential confounders, (3) Use statistical controls (regression), (4) Randomization in experiments. Common confounders: socioeconomic status, age, health status, time trends. Good research designs anticipate and measure likely confounders; poor research ignores confounding leading to wrong conclusions.
When can you make causal claims from observational data?
Causal claims from observational data require: (1) Strong theoretical basis, clear mechanism how cause produces effect, (2) Multiple lines of evidence, many studies showing consistent relationship, (3) Dose-response relationship, more exposure, larger effect, (4) Temporal precedence, cause precedes effect clearly, (5) No plausible confounders, or statistical control for known confounders, (6) Specificity, relationship holds across contexts, (7) Natural experiments, situations approximating randomization. Examples where observational evidence established causation: smoking and lung cancer, lead exposure and cognitive impairment. Still weaker than experimental evidence, always prefer randomized trials when ethical and practical. Be very skeptical of causal claims from single observational study. Multiple converging lines of evidence over years build confidence in causal claims.
How should you communicate correlational findings responsibly?
Responsible communication: (1) Use correlation language, ‘associated with,’ ‘related to,’ not ‘causes’ or ‘leads to,’ (2) Acknowledge limitations, observational data can’t prove causation, (3) Mention alternative explanations, confounding, reverse causation, (4) Avoid causal framing, ‘eating X linked to Y’ not ‘eating X prevents Y,’ (5) Include effect sizes, how strong is relationship, (6) Report confidence intervals, uncertainty in estimates, (7) Provide context, mechanism if known, prior research, (8) Note if correlation is preliminary needing further research. Bad communication: headlines saying ‘X causes Y’ from single correlational study. Good communication: ‘Study finds association between X and Y; researchers suggest possible mechanisms but causation not established; randomized trials needed.’ Correlation is valuable for generating hypotheses and suggesting where to investigate causation, just don’t claim causation prematurely.