Analytics: In 2012, Harvard Business Review declared data scientist "the sexiest job of the 21st century." The article, by Thomas Davenport and DJ Patil, described a new kind of professional who combined statistical expertise with programming skill and business curiosity-a "rare blend" that companies would pay handsomely to find.
The supply of such people was tiny. Demand exploded.
A decade later, the data science market had bifurcated in ways Davenport and Patil hadn't anticipated. Some "data scientists" were building sophisticated machine learning systems deployed in real-time production environments. Others were writing SQL queries and maintaining dashboards.
The job title had become so broad as to be nearly meaningless. In 2022, Harvard Business Review published the follow-up question: "Is Data Scientist Still the Sexiest Job of the 21st Century?" The answer was complicated. The role had fragmented, matured, and partially merged with adjacent disciplines-including analytics.
The confusion between analytics and data science is not merely semantic. It determines hiring decisions, team structures, tool investments, career trajectories, and whether organizations actually become data-driven or simply spend heavily on data capabilities they can't use effectively.
Companies that conflate the two end up hiring data scientists to build dashboards (expensive analysts) or analysts to build machine learning pipelines (projects that fail). Both outcomes are common. Both are avoidable.
Two Disciplines, Two Questions
The clearest distinction between analytics and data science lies in the questions each discipline is designed to answer.
Analytics asks: What happened? Why did it happen? What is happening now? What are the patterns across this historical data?
Data science asks: What will happen next? How can we automate this decision? What hidden structure exists in this data that no human could find manually? What is the best action to take given this situation?
Analytics is primarily descriptive and diagnostic-understanding what has occurred and why. Data science is primarily predictive and prescriptive-forecasting what will occur and recommending or automating action.
This distinction shapes everything downstream: the skills required, the tools used, the organizational structures that work, the timeline from question to value, and the type of business impact generated.
Analytics in Practice
Consider a data analyst at Spotify investigating why premium subscription cancellations increased 15% in Q3 2023. The analyst:
- Pulls cancellation data from the data warehouse using SQL, joining subscription events with user demographics, listening behavior, and billing history
- Segments cancellations by geography, subscription tenure, device type, plan type, and payment method
- Identifies that cancellations spiked disproportionately among users in Germany and Austria following a price increase announced in August, with the effect concentrated among users who had been subscribers for less than 12 months
- Visualizes the trend in Tableau, showing the pre- and post-increase cancellation curves
- Presents findings to the product and pricing teams with a specific recommendation: test a loyalty discount for subscribers approaching the 12-month mark in price-sensitive markets
The analyst answered a specific business question using existing data, established statistical methods, and clear communication. The output is insight that drives a product or pricing decision. From query to presentation took three days.
Data Science in Practice
A data scientist at Spotify, working on the churn problem from a different angle, builds a churn prediction model. The work involves:
- Engineering hundreds of features from user behavior data: listening frequency by time of day, playlist creation rate, skip rate by genre, session duration trends over the past 90 days, ratio of podcasts to music, premium feature usage (offline downloads, high-quality streaming), social features engagement
- Training a gradient boosting model (likely LightGBM or XGBoost) on 18 months of labeled historical data, with churned users as positive examples
- Evaluating model performance using area under the ROC curve, precision-recall at various thresholds, and calibration plots
- Deploying the model to production infrastructure where it scores every subscriber's 30-day churn probability daily
- Integrating model outputs with the marketing automation platform, which automatically triggers targeted retention offers (discount, free month, playlist curation) for subscribers crossing a risk threshold
The data scientist built a system that makes automated, personalized predictions at scale-potentially millions of predictions per day-and acts on them without human involvement in each individual case. The output is a model embedded in a product. From initial concept to production deployment took four months.
Both the analyst and the scientist are doing valuable, technically demanding work. Neither is doing the other's job. The analyst could not have productionized a real-time scoring system; the scientist would have been frustrated and underutilized investigating a single-quarter cancellation spike.
Skill Profiles: Deeply Different Foundations
The overlap between analytics and data science is real but smaller than the job market often implies.
The Data Analyst Toolkit
Core technical skills:
- SQL: The essential language of analytics. Analysts write complex queries daily-window functions, CTEs, nested subqueries, multi-table joins. SQL proficiency is non-negotiable.
- Business intelligence platforms: Tableau, Power BI, Looker, Mode, Metabase. Analysts spend significant time building and maintaining dashboards and reports.
- Spreadsheets: Excel and Google Sheets remain indispensable for ad-hoc analysis, quick calculations, and sharing results with non-technical stakeholders.
- Descriptive and inferential statistics: Means, medians, distributions, confidence intervals, hypothesis testing. Enough to correctly interpret A/B test results and avoid common statistical errors.
- Data visualization: Not just tool proficiency but design judgment-knowing which chart type communicates which insight, when to use color versus position, how to reduce chart junk.
Critical non-technical skills:
- Business domain knowledge: Understanding what questions matter, which metrics connect to business outcomes, and what context surrounds the numbers
- Communication: Translating technical findings for non-technical audiences, structuring presentations, knowing what to include and what to omit
- Stakeholder management: Navigating competing priorities, setting expectations about timelines, negotiating scope
Supplementary technical skills that increase leverage:
- Python or R for analysis more complex than SQL can handle
- Basic statistical modeling (regression, segmentation, A/B test design)
- Data modeling concepts and understanding of how data warehouses work
The Data Scientist Toolkit
Core technical skills:
- Programming: Python at an intermediate-to-advanced level. Comfortable with object-oriented programming, debugging, writing production-quality code. R is an alternative in academic and research contexts.
- Machine learning: Understanding of supervised and unsupervised algorithms well enough to choose appropriately, tune hyperparameters, evaluate model performance, and diagnose failure modes. Linear and logistic regression, decision trees, random forests, gradient boosting, neural networks, k-means clustering, dimensionality reduction.
- Feature engineering: The art of creating informative input variables from raw data. This is where domain expertise combines with ML knowledge and accounts for a disproportionate share of model performance.
- Statistics at depth: Bayesian inference, probability theory, experimental design, causal inference. Not just applying tests but understanding the mathematical foundations.
- Model deployment: How models move from Jupyter notebooks to production APIs. Docker, REST APIs, MLflow, model serving infrastructure.
Supplementary technical skills:
- Deep learning frameworks (PyTorch, TensorFlow) for image, text, and sequence data
- Natural language processing for text analysis
- Distributed computing (Apache Spark, Dask) for datasets too large for a single machine
- Cloud ML platforms (AWS SageMaker, Google Vertex AI, Azure Machine Learning)
- Software engineering practices: version control, testing, CI/CD for ML code
The Genuine Overlap
Both roles share critical foundations:
- SQL: Every data professional needs to query structured data fluently
- Data cleaning and preparation: Both roles report spending 60-80% of their time on data wrangling, not on the analysis or modeling itself
- Critical thinking: Questioning assumptions, identifying biases, understanding what data does and doesn't prove
- Domain knowledge: Neither statistical sophistication nor ML expertise compensates for not understanding what you're measuring
- Communication: Findings that aren't communicated effectively produce no business value regardless of technical quality
The overlap is why the roles are frequently confused from the outside and why individuals can sometimes perform both. A senior analyst who builds regression models and a junior data scientist who primarily creates dashboards can look identical in job listings.
The distinction matters more at the level of what the role is primarily for than in what any specific person happens to be doing on a given day.
When Organizations Need Analytics vs. Data Science
One of the most consistent patterns in the data industry is that organizations invest in data science capability before building the analytics foundation that makes data science possible. This reliably produces expensive failure.
Start with Analytics
Most organizations should build robust analytics capability before data science. Analytics delivers immediate business value with lower investment and lower technical risk:
- Dashboards and reporting infrastructure that give everyone visibility into what is happening
- Ad-hoc analysis capability that answers the CEO's question by Friday afternoon
- A/B test design and analysis that tells you whether product changes work
- KPI frameworks that connect operational metrics to business outcomes
- Customer and user segmentation that enables targeted decisions
Example: Airbnb's early data team was analytics-first. From 2010 to 2013, the team built dashboards showing host and guest metrics, analyzed search behavior to identify conversion bottlenecks, and tracked the funnel from listing view to completed booking.
This analytics work directly informed product decisions worth hundreds of millions in revenue improvement. The company did not invest heavily in ML-based recommendation systems until years later, when the analytics foundation had been established and the data pipelines were mature.
The sequence matters. You cannot build a churn prediction model before you have defined what "churn" means for your business, have clean data about user activity, understand which user behaviors precede churn through basic descriptive analysis, and have data pipelines reliable enough to train and retrain a model on fresh data.
All of these prerequisites are analytics problems.
Graduate to Data Science
Data science becomes the right investment when:
Decisions need to scale beyond human capacity. A human analyst cannot manually review 10 million transactions per day for fraud patterns. A fraud detection model can. When the volume of decisions to be made exceeds what humans can process with reasonable quality, machine learning is the only solution.
Prediction has clear, quantified business value. Netflix's recommendation system generates an estimated $1 billion annually in reduced churn by keeping subscribers engaged with content they love. Uber's dynamic pricing system optimizes supply-demand matching in real time across hundreds of markets.
Amazon's demand forecasting prevents both stockouts and excess inventory. These applications have specific, measurable economic value that justifies substantial ML investment.
Pattern detection requires scale that exceeds human analysis capacity. Spotify processes billions of listening events daily. No analyst can review this data to find the patterns that drive music discovery.
The patterns that fuel Discover Weekly and Release Radar emerge from algorithmic analysis of behavioral data at a scale no human team could explore.
Real-time, automated decisions are required. Ad bidding decisions must be made in 100 milliseconds. Content ranking for a social feed must update continuously as new content is posted and user behavior changes. These latency and throughput requirements make human analysis impossible; only automated ML systems can operate at this speed.
The analytics foundation is solid. Without clean data, reliable pipelines, well-understood metrics, and a team that understands the business domain deeply, data science projects consistently fail. ML models are not magic; they are optimization processes that require high-quality inputs to produce high-quality outputs.
The Premature Data Science Trap
The pattern repeats in companies of every size and sector. A CEO reads about machine learning, attends a conference on AI, or benchmarks against a competitor that has published about their ML capabilities. The company hires data scientists before the analytics foundation exists.
Monica Rogati, former VP of Data at Jawbone and one of the most widely cited voices in data team building, described this as the AI Hierarchy of Needs. At the base: reliable data collection, storage, and processing infrastructure. In the middle: analytics, business metrics definition, and A/B testing capability.
At the top: machine learning and artificial intelligence. The hierarchy is not arbitrary. Each layer depends on the layers below. You cannot skip levels without the whole structure collapsing.
In practice, data scientists hired into organizations without analytics foundations spend 80% of their time cleaning data, answering ad-hoc questions, and building dashboards-work they are overqualified and overpaid to perform. No clean data exists to train models.
No clear problem definition exists because basic business questions remain unanswered. The data scientists leave, frustrated, and the organization concludes that data science doesn't work for them. The real problem was sequencing.
Tools: Converging but Still Distinct
Analytics Tools Ecosystem
| Category | Leading Tools |
|---|---|
| SQL and Query Engines | PostgreSQL, BigQuery, Snowflake, Redshift, DuckDB |
| Business Intelligence | Tableau, Power BI, Looker, Mode, Metabase, Superset |
| Product Analytics | Mixpanel, Amplitude, Heap, Google Analytics 4 |
| Light Programming | Python (pandas, matplotlib, seaborn), R (tidyverse, ggplot2) |
| Spreadsheets | Excel, Google Sheets |
Data Science Tools Ecosystem
| Category | Leading Tools |
|---|---|
| Programming Environments | Jupyter, VS Code, Google Colab, Databricks Notebooks |
| ML Libraries | scikit-learn, XGBoost, LightGBM, CatBoost |
| Deep Learning | PyTorch, TensorFlow, Keras, JAX |
| Big Data Processing | Apache Spark (PySpark), Dask, Ray |
| ML Platforms | AWS SageMaker, Google Vertex AI, Azure ML, MLflow |
| Experiment Tracking | Weights & Biases, Neptune, MLflow |
| Feature Stores | Feast, Tecton, Hopsworks |
The Convergence
Tool boundaries are genuinely blurring in ways that affect both roles.
dbt (data build tool) has made SQL-based transformation sophisticated enough that skilled analysts perform work that previously required Python engineers.
dbt brings software engineering practices-version control, testing, modular code-to SQL, creating a new hybrid role called analytics engineer that sits between traditional analytics and data engineering.
AutoML tools (H2O.ai, Google AutoML, Amazon SageMaker Autopilot) allow analysts to build basic predictive models without deep ML knowledge. They handle algorithm selection, hyperparameter tuning, and model evaluation automatically.
For problems where "good enough" prediction is valuable, AutoML enables analysts to access ML capabilities without becoming data scientists.
Cloud data platforms like Databricks and Snowflake increasingly offer both analytics and ML capabilities in unified environments. A team can run SQL analytics alongside ML training pipelines in the same platform, reducing infrastructure complexity and enabling closer collaboration between analysts and scientists.
These convergences don't eliminate the distinction-productionizing complex ML systems, developing novel modeling approaches, and working with unstructured data (text, images, audio) still require deep data science expertise-but they do allow analytically strong generalists to handle a broader range of problems.
Career Trajectories and Compensation
Analytics Career Path
The typical analytics career progression:
- Junior/Associate Data Analyst: SQL queries, dashboard maintenance, report generation, data extraction for business stakeholders. US total compensation: $55,000-$80,000.
- Data Analyst: Independent analysis, A/B test design and interpretation, stakeholder presentations, light Python/R. US total compensation: $75,000-$110,000.
- Senior Data Analyst: Complex multi-dataset analyses, mentoring junior analysts, project leadership, significant business impact. US total compensation: $100,000-$145,000.
- Analytics Manager / Lead Analyst: Team leadership, strategy development, cross-functional partnerships. US total compensation: $130,000-$180,000.
- Director/VP of Analytics: Department leadership, executive partnerships, data strategy, organizational influence. US total compensation: $170,000-$300,000+.
Data Science Career Path
- Junior Data Scientist: Model building under supervision, feature engineering, exploratory analysis, Kaggle-level ML work. US total compensation: $90,000-$130,000.
- Data Scientist: Independent model development, deployment, experimentation, research. US total compensation: $130,000-$185,000.
- Senior Data Scientist: Complex modeling, novel research, technical mentorship, high-impact projects. US total compensation: $170,000-$250,000.
- Staff/Principal Data Scientist: Setting technical direction for teams, leading ambiguous high-stakes projects. US total compensation: $220,000-$350,000+.
- Director of Data Science / Chief Data Officer: Organization-wide data strategy, executive team partnership. US total compensation: $250,000-$500,000+.
These ranges reflect base plus equity and bonus at technology companies. Non-tech industries typically pay 20-40% less for equivalent roles.
Data science roles command higher compensation because they require rarer skills (ML, software engineering, advanced statistics simultaneously) and enable automation that scales across the entire business.
The compensation gap narrows at the leadership level, where analytics directors managing large, high-impact teams earn comparably to senior individual contributor data scientists.
The Analyst-to-Data-Scientist Transition
This is one of the most common career transitions in the data field, and it is genuinely achievable. The advantages analysts bring to the transition are significant: deep business domain knowledge, understanding of data quality issues, communication skills, and intuition about which questions matter.
The gaps to fill are technical: machine learning knowledge, stronger programming skills, understanding of model deployment, and statistical depth.
A realistic transition timeline for a senior analyst with strong SQL and some Python: 9-18 months of focused skill development. Resources include Andrew Ng's Machine Learning Specialization on Coursera (still considered the best entry point), fast.ai for practical deep learning, and Kaggle competitions for hands-on ML practice.
Building a portfolio of ML projects-applied to real business problems from current or recent work-matters more than any credential.
The transition works best when driven from analytics toward data science problems that were identified during analytics work. "I kept noticing that we couldn't predict X, and I want to build that" is the right motivation; "data science pays more" without clear problem-space motivation tends to produce frustration.
'The sequencing matters enormously. Companies that invest in data science before building the analytics foundation are like companies that invest in elite athletes before building the stadium. The investment cannot deliver its value because the supporting infrastructure does not exist. Build the analytics foundation first.'
- Monica Rogati, former VP of Data at Jawbone, from "The AI Hierarchy of Needs" (2017)
Organizational Structures That Work
Centralized data team: A single team handles analytics and data science. Works for smaller organizations (under 100 employees, or early-stage companies). Risk: conflicting priorities, career path confusion, difficulty recruiting senior specialists who want to work with peers.
Embedded model: Analysts and data scientists sit within business units (product, marketing, finance, operations). Works for large organizations where business proximity is critical. Risk: inconsistent methods, duplicated infrastructure, difficulty maintaining cross-team standards.
Hub-and-spoke: A central data platform team provides infrastructure, tooling, standards, and shared services. Analytics and data science practitioners are embedded in business units but connected to the center.
This model balances organizational consistency with business proximity and is the dominant model among mature technology companies.
Center of excellence: A dedicated data science team handles the most technically demanding ML work across the organization, while embedded analysts handle business unit analytics. The CoE provides expertise as a service. Works when ML applications are concentrated in specific high-value areas.
Example: Uber has used a hub-and-spoke variant for years. A central data platform team maintains the data infrastructure, tooling standards, and shared services. Product areas have embedded analysts and data scientists who own their domains but operate within shared standards.
The central team handles the hardest cross-cutting problems (driver supply forecasting, marketplace optimization) while embedded teams handle area-specific problems.
The Data Maturity Spectrum
Organizations progress through recognizable stages:
Stage 1 - Reactive reporting: Someone exports data into spreadsheets when the CEO asks a question. No infrastructure, no consistency, no repeatability.
Stage 2 - Standardized analytics: A data warehouse exists. Dashboards provide regular reporting. Analysts can answer business questions independently. This is where most investment should be concentrated for organizations below this stage.
Stage 3 - Predictive analytics: Statistical models forecast outcomes. A/B testing is rigorous and pre-specified. Data informs most major decisions. Causal thinking is common.
Stage 4 - Embedded data products: ML models are embedded in customer-facing and internal products. Recommendations, predictions, and automated decisions run at scale. Data science is a competitive capability.
Stage 5 - Data-driven culture: Data literacy is pervasive. Self-service analytics is genuinely self-service. Data science continuously pushes into new domains. Every strategic decision integrates quantitative analysis.
Most organizations that hire aggressively for data science capability are at Stage 1 or 2. Building the data pipeline infrastructure and the analytics foundation at Stages 2 and 3 is the prerequisite for effective data science at Stage 4.
Making the Right Choice
For individuals choosing a career direction: Analytics is the better starting point for most people. It develops business understanding, communication skills, and data intuition that transfer directly to data science if you choose to transition.
It also provides a complete, highly valued career path for those who prefer working closer to business strategy than to algorithmic systems. Transition to data science when you find yourself consistently hitting problems that analytics cannot address-specifically, when prediction and automation are what's needed.
For organizations building data teams: Start with analytics and prove the business value of data-driven decision making before investing in data science. When you can articulate specific, high-value use cases for prediction and automation-and when your data infrastructure is reliable enough to support them-add data science capability.
For leaders making hiring decisions: Confusing the roles produces reliable failure. A data scientist hired to do analytics work will be demotivated and expensive. An analyst asked to build production ML systems will struggle and fail.
Understand what question you are trying to answer, map that to the appropriate discipline, and hire accordingly. Titles matter less than the clarity of what you need someone to do.
See also: Data Pipelines Explained, Analytics Mistakes Explained, Dashboards That Actually Work
What Research Shows About Analytics and Data Science Effectiveness
The organizational literature on analytics and data science effectiveness points to a consistent and somewhat counterintuitive finding: the bottleneck is rarely technical.
A 2022 survey by NewVantage Partners of 92 Fortune 1000 executives found that 80.5 percent cited cultural and organizational challenges as the primary barrier to becoming data-driven, versus fewer than 20 percent citing technology limitations.
This mirrors earlier findings from MIT Sloan Management Review's research program on AI and machine learning adoption, which found that firms with high data literacy and experimentation culture outperformed those with better technology but weaker cultures.
Thomas Davenport, whose 2012 Harvard Business Review article with DJ Patil defined the data scientist archetype, followed this in 2022 with a reassessment in the same publication noting that the role had fragmented in ways they had not anticipated.
Davenport observed that the original "unicorn" vision of data scientists - simultaneously expert statisticians, programmers, and business strategists - had proven unrealistic at scale.
Companies that succeeded in building analytics and data science capability had typically separated these skill sets into distinct, collaborative roles rather than seeking individuals who combined all of them.
Academic research by Sinan Aral at MIT's Sloan School studied the economic returns to A/B testing programs at technology companies.
His 2020 book The Hype Machine synthesized findings showing that companies running mature, high-frequency A/B testing programs - which he characterized as the operational expression of analytics culture - showed significantly higher revenue per user than comparable companies relying on intuition-based product decisions.
He documented specific cases at Facebook, Twitter, and e-commerce platforms where the cumulative effect of hundreds of small, data-informed improvements compounded into substantial competitive advantages over 3-5 year periods.
Ron Kohavi, who built experimentation programs at Amazon (where he led the Data Mining and Personalization team) and Microsoft (where he led the Analysis and Experimentation team), published extensive research on the value of online controlled experiments.
His team at Microsoft found that approximately two-thirds of internally championed product changes - ideas that product managers and executives were confident would work - showed no improvement or statistically significant negative results when tested properly.
This finding, replicated at Google, Bing, and LinkedIn, established the evidential basis for why analytics-informed experimentation culture produces better outcomes than expert intuition alone.
Monica Rogati's AI Hierarchy of Needs framework, which places basic analytics below machine learning in the prerequisite stack, has been empirically validated through the failure patterns of organizations that inverted the sequence.
A 2019 study by VentureBeat's AI research team found that 87 percent of AI projects never make it to production deployment.
Among the primary causes: insufficient clean data, unclear problem definition, and lack of analytics infrastructure to support model development and monitoring - all problems that mature analytics capability would have addressed before data science investment began.
Real-World Case Studies: When Analytics and Data Science Diverged
Stitch Fix: Analytics and Data Science as Distinct Functions. Stitch Fix, the personal styling service, built one of the most discussed analytics-and-data-science organizations in the technology industry.
Their chief algorithms officer Eric Colson published extensively on how Stitch Fix separated analytics work (understanding what customers bought, returned, and rated; tracking stylist performance; monitoring inventory flow) from data science work (building the recommendation models that suggested items for each "fix," the demand forecasting models that determined what to stock, and the inventory routing algorithms that matched inventory to demand).
Colson's documented finding: attempts to combine both roles in single individuals produced suboptimal performance in both domains.
Analytics specialists understood the business deeply but lacked machine learning depth; data scientists could build sophisticated models but were less effective at the business-question translation work analytics requires.
LinkedIn: The Analyst-to-Data-Scientist Pipeline. LinkedIn's data organization, led in its scaling years by DJ Patil (who later became the U.S. Chief Data Scientist), was known for deliberately building analytics capability before scaling data science.
LinkedIn's analytics teams established baseline metrics for member engagement, connection growth, and content consumption - metrics that became the foundation for data science work on the "People You May Know" feature and the feed ranking algorithm.
Tim Converse and Igor Perisic, who led parts of LinkedIn's analytics function during this period, documented that the analytics foundation - clean data, reliable metrics definitions, and investigative analytical capability - had to exist before recommendation system development was viable.
Google: When Data Science Requires Analytics Prerequisites. Google's RankBrain, the machine learning component introduced into Google's ranking algorithm in 2015 (confirmed publicly by Google's Greg Corrado at the time), represented a case where data science capability was layered on top of an analytics foundation built over more than a decade.
The system used neural networks to interpret ambiguous or novel queries - but its training data came from years of query logs, click-through rate measurements, and user satisfaction signals that Google's analytics teams had been collecting and refining since the early 2000s.
Google's John Mueller has noted in various public forums that RankBrain's effectiveness depended critically on the quality and representativeness of that historical behavioral data - a data science application built on an analytics infrastructure.
Walmart Labs: The Premature Data Science Trap Avoided. Walmart's technology arm made a deliberate organizational decision in 2012, documented by then-SVP Anand Rajaraman, to invest in analytics infrastructure - including a unified data warehouse and standardized metrics definitions across business units - before scaling data science.
The specific impetus was discovering that different business units were reporting different values for the same metrics, making cross-unit analytics impossible.
The two years spent on analytics infrastructure before data science investment was, Rajaraman documented, directly responsible for the eventual success of personalization and demand-forecasting projects that would have failed without clean, consistent data foundations.
Common Mistakes at the Analytics-Data Science Boundary
Mistake 1: Hiring Data Scientists to Do Analytics Work. The pattern is well-documented and reliably expensive. A company with limited analytics capability hires data scientists in the belief that more sophisticated practitioners will solve more basic data problems.
The data scientists arrive to find no clean data, no clear problem definitions, and no analytics infrastructure on which to build models. They spend their time on data cleaning, dashboard building, and answering ad-hoc questions - work they are overqualified and overpaid to perform.
A 2020 Kaggle survey of over 20,000 data scientists found that data preparation and cleaning consumed the majority of most practitioners' time, regardless of their seniority or technical sophistication.
This is not an argument against cleaning data; it is an argument for building analytics engineering capability that cleans data systematically before data science work begins.
Mistake 2: Treating Data Science Projects as One-Time Deployments. Analytics produces insights; data science produces systems that must be maintained. Organizations that evaluate data science projects only on initial development cost and accuracy at launch systematically underestimate total cost of ownership.
A 2015 paper by Google's D. Sculley and colleagues, "Hidden Technical Debt in Machine Learning Systems" - now one of the most cited papers in the field of ML engineering - documented the categories of ongoing cost that make data science systems more expensive over time than their initial development suggested: model monitoring, retraining pipelines, feature store maintenance, and the compounding cost of technical debt in model code.
Companies that build analytics processes to monitor model performance over time - which is fundamentally an analytics problem - sustain data science investments better than those that do not.
Mistake 3: Confusing Correlation in Dashboards with Causation for Model Inputs. Analytics teams frequently identify correlations - users who do X have higher retention; products with attribute Y have higher conversion rates - that data science teams then build into prediction models.
When the correlation is spurious, the model encodes the spuriousness at scale. DJ Patil has described this failure pattern as "garbage in, garbage out at production speed." The corrective is having analytics teams apply the causal inference rigor described by researchers like Judea Pearl (whose Book of Why is now standard reading in advanced analytics programs) before handing feature definitions to data science teams.
The analytics question - "is this relationship causal or correlational?" - determines whether the data science application will work in deployment.
Sources & Further Reading
- Davenport, Thomas H. and Patil, D.J. "Data Scientist: The Sexiest Job of the 21st Century." Harvard Business Review, October 2012. View source
- Rogati, Monica. "The AI Hierarchy of Needs." Hackernoon, 2017. View source
- Ng, Andrew. "Machine Learning Specialization." Coursera / DeepLearning.AI. View source
- dbt Labs. "What is Analytics Engineering?" dbt. View source
- Stitch Fix. "Algorithms Tour." Stitch Fix Technology. View source
- Patil, DJ. "Building Data Science Teams." O'Reilly Media, 2011.
- Kohavi, Ron, Tang, Diane, and Xu, Ya. Trustworthy Online Controlled Experiments. Cambridge University Press, 2020.
- Levels.fyi. "Data Scientist Compensation Data." levels.fyi. View source
- Netflix Technology Blog. "Netflix Recommendations: Beyond the 5 Stars." Netflix Tech Blog, 2012. View source
- Airbnb Engineering and Data Science. "How Airbnb Uses Data Science." Airbnb Tech Blog. View source
Frequently Asked Questions
What is the fundamental difference between analytics and data science?
Analytics focuses on analyzing existing data to answer specific business questions and inform decisions, ‘what happened, why did it happen, what should we do?’ Data science builds models and systems to make predictions, automate decisions, and find patterns in data, ‘what will happen, how can we predict outcomes?’ Analytics is typically backward-looking (historical analysis) or present-focused (current performance). Data science is forward-looking (predictions, forecasting). Analytics answers known questions with established methods. Data science explores new questions, creates new methods, and builds data products. Both involve working with data, but data science is more technical, requires stronger programming and statistical skills, and produces models rather than just insights.
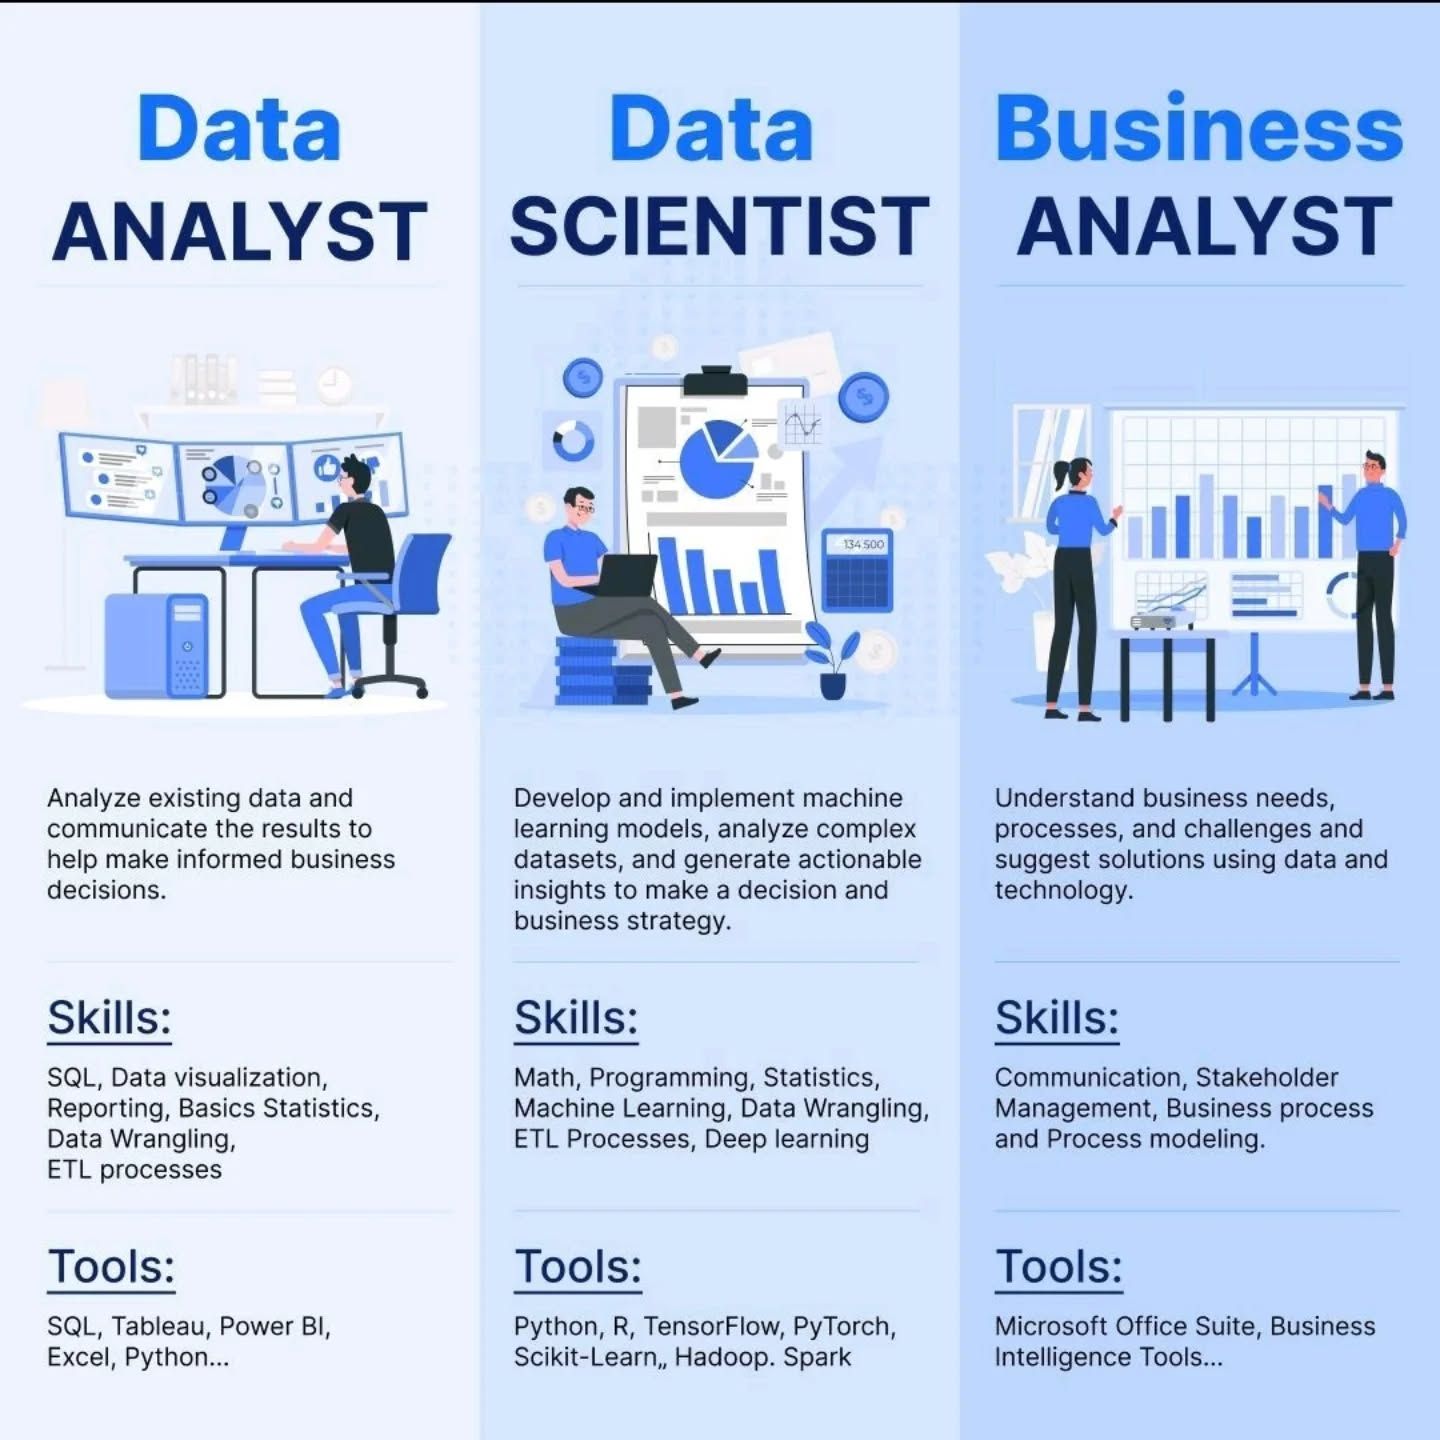
What skills does a data analyst need versus a data scientist?
Data Analyst skills: SQL for querying databases, Excel/spreadsheet proficiency, business intelligence tools (Tableau, Power BI), basic statistics, data visualization, business acumen to understand context, communication to explain insights, and some programming (Python, R helpful but not always required). Data Scientist skills: strong programming (Python, R), advanced statistics and mathematics, machine learning algorithms, data engineering, model building and evaluation, computer science fundamentals, and research methodology. Both need: critical thinking, problem framing, data cleaning, and storytelling. Data science requires deeper technical skills; analytics requires stronger business understanding. Many analysts grow into data science roles by developing technical skills; many data scientists start in analytics roles.
When does an organization need analytics versus data science?
Need analytics for: understanding business performance, creating dashboards and reports, analyzing customer behavior, tracking KPIs, identifying trends, optimizing processes, A/B test analysis, and answering ‘what’s happening and why?’ questions. Need data science for: building recommendation systems, predictive models (churn prediction, demand forecasting), natural language processing, image recognition, fraud detection, automated decision systems, and complex pattern detection in large datasets. Most organizations start with analytics (immediate business value, easier to implement) before investing in data science (requires more specialized talent, infrastructure, and data maturity). Small organizations may only need analytics; large organizations benefit from both working together.
How do analytics and data science work together in practice?
Collaboration patterns: (1) Analysts identify business problems and opportunities through exploratory analysis, (2) Data scientists build predictive models to address those problems, (3) Analysts monitor model performance and identify when models need updating, (4) Data scientists create features and prepare data, analysts use those features for business analysis, (5) Analysts communicate insights to business stakeholders, data scientists focus on technical implementation, (6) Both work together on experimentation, analysts design tests, data scientists analyze results statistically. Effective teams have: clear role boundaries with overlapping skills, shared tools and data infrastructure, regular communication, and mutual respect for different skill sets. Analysts keep data science grounded in business reality; data scientists expand what’s possible beyond traditional analytics.
What tools are used in analytics versus data science?
Analytics tools: Business intelligence platforms (Tableau, Power BI, Looker), SQL databases, Excel/Google Sheets, Google Analytics, statistical analysis tools, and simple Python/R scripts. Data Science tools: Programming languages (Python, R), machine learning frameworks (scikit-learn, TensorFlow, PyTorch), Jupyter notebooks, big data tools (Spark, Hadoop), cloud ML platforms (AWS SageMaker, Azure ML, Google AI Platform), version control (Git), and production deployment tools. Overlap: Both use SQL, Python, R, visualization libraries, and cloud platforms. Distinction: Analytics tools focus on querying, aggregating, and visualizing existing data. Data science tools focus on building, training, evaluating, and deploying models. Tool choice matters less than understanding when to use which approach.
Can someone transition from analytics to data science, and how?
Yes, it’s a common career path. Transition strategy: (1) Strengthen programming, become proficient in Python or R, (2) Learn statistics and probability deeply, (3) Study machine learning fundamentals and common algorithms, (4) Take online courses or bootcamps in data science, (5) Build projects demonstrating ML skills (Kaggle competitions, personal projects), (6) Start applying ML to analytics problems at current job, (7) Learn data engineering basics (pipelines, databases, cloud platforms), (8) Develop computer science fundamentals, (9) Network with data scientists, (10) Look for data science roles at current company or externally. Timeline: typically 6-18 months of focused learning. Advantages analysts bring: business understanding, communication skills, and knowledge of what problems matter, add technical skills to become well-rounded data scientist.
What are the career paths and compensation for analytics vs data science?
Analytics career path: Junior Analyst → Analyst → Senior Analyst → Analytics Manager → Director of Analytics → VP Analytics/Head of Business Intelligence. Data Science path: Junior Data Scientist → Data Scientist → Senior Data Scientist → Lead/Principal Data Scientist → Director of Data Science → Chief Data Officer. Compensation (US, 2026 estimates): Entry-level analyst \(60-80K, Senior analyst \)90-120K, Analytics manager \(120-160K. Entry-level data scientist \)90-120K, Senior data scientist \(130-180K, Lead/Principal \)180-250K+. Data science typically pays more due to: higher technical requirements, scarcer talent, and direct impact on revenue (ML-powered products). Both fields offer strong career prospects, choose based on interests (business problems vs. technical challenges) not just compensation. Geographic location, industry, and company size significantly affect these numbers.