
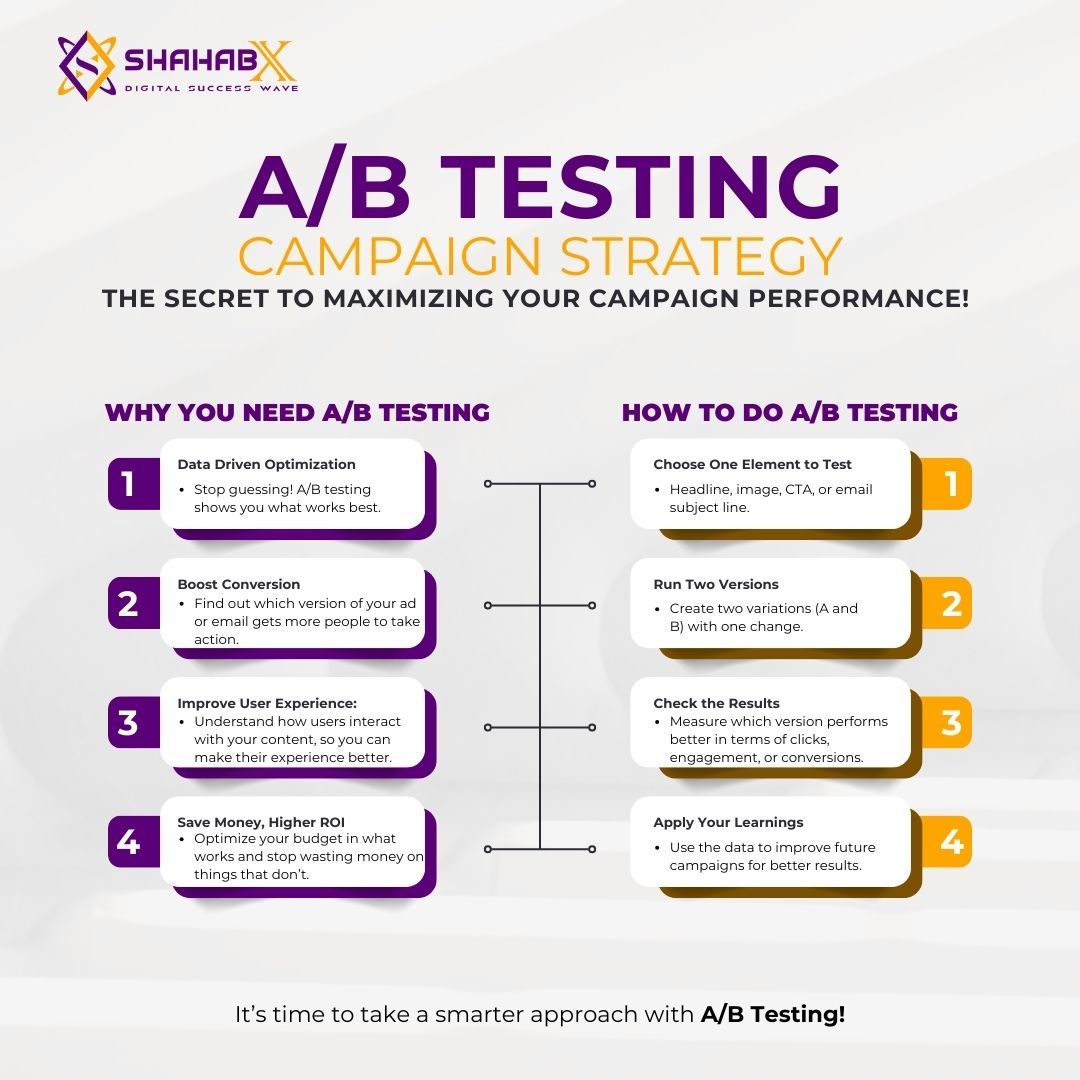
Testing: Every major change you experience in a product you use - a redesigned button, a reordered feed, a new checkout flow - was almost certainly tested against the previous version before it shipped.
This is A/B testing: a controlled experiment that shows two versions of something to randomly assigned groups of users and measures which performs better.
It is the closest thing to a scientific method that product development has adopted at scale, and when done well, it is genuinely powerful. When done badly, it produces confident-sounding results that mean nothing.
A/B testing has become central to how technology companies make decisions. Google has reportedly run tens of thousands of search experiments per year. Netflix continuously experiments with thumbnail images, recommendation interfaces, and content presentation.
Amazon tests checkout flows relentlessly. The experimentation culture that emerged from the early internet companies - where the cost of trying a change was low and user behavior was immediately measurable - has spread into e-commerce, media, financial services, and increasingly into physical product design, retail, and policy evaluation.
But the proliferation of A/B testing has also produced a proliferation of A/B testing mistakes. Statistical significance is misunderstood and misapplied. Tests are stopped too early. Multiple variants are tested against each other without accounting for multiple comparisons.
Sample sizes are chosen by gut rather than power calculation. Results are celebrated without checking whether they are practically meaningful. Understanding how to run tests correctly - and how to recognize when results cannot be trusted - is as important as understanding the mechanics.
"Running an experiment is easy. Running an experiment that actually tells you something true is hard." - Ron Kohavi, experimentation researcher, Microsoft and Google
Key Definitions
A/B test: A controlled experiment in which users are randomly assigned to one of two or more variants of something, and outcomes are measured to assess whether the variants differ in a meaningful way.
Statistical significance: A threshold for deciding whether an observed result is unlikely to have occurred by chance alone, if the null hypothesis (no difference between variants) were true. Conventionally set at a p-value below 0.05.
P-value: The probability of observing a result at least as extreme as the one found, assuming no true difference exists. A p-value of 0.05 means a 1-in-20 chance of the result arising from random variation under the null hypothesis.
Statistical power: The probability that a test will detect a real effect if one exists. Typically targeted at 80% or higher. Low-powered tests miss real effects frequently, producing unreliable null results.
Minimum detectable effect (MDE): The smallest effect size that would be practically meaningful to detect. Determines required sample size in conjunction with power and significance thresholds.
Null hypothesis: The assumption that there is no difference between variants being tested. Statistical testing asks how likely the observed data would be if the null hypothesis were true.
Type I error (false positive): Concluding that a difference exists when it does not. The probability of a Type I error equals the significance threshold (alpha).
Type II error (false negative): Failing to detect a real difference. The probability of a Type II error equals 1 minus statistical power (beta).
CUPED (Controlled-experiment Using Pre-Experiment Data): A variance reduction technique that uses pre-experiment user behavior to improve the sensitivity of A/B tests, reducing the sample size required to detect a given effect.
Holdout experiment: A long-duration experiment where a small control group is permanently excluded from a treatment to measure its cumulative long-term effect, often used by companies like Netflix to evaluate features whose value compounds over time.
A/B Testing Design Checklist
| Step | What to Define | Why It Matters |
|---|---|---|
| 1. Hypothesis | What change you are testing and what outcome you expect | Prevents post-hoc rationalization of results |
| 2. Primary metric | Single outcome variable you will use to decide | Prevents multiple comparisons inflation |
| 3. Sample size | Calculate before the test starts (MDE, power, alpha) | Ensures test has enough data to be interpretable |
| 4. Duration | Minimum runtime to capture full user behavior cycles | Avoids day-of-week effects and novelty bias |
| 5. Randomization | Confirm users are randomly and consistently assigned | Prevents selection bias and contamination |
| 6. Analysis timing | Single planned analysis at the end | Prevents peeking-inflated false positive rates |
| 7. Guardrail metrics | Metrics that must not degrade | Catches improvements that come at hidden costs |
| 8. Variance reduction | Apply CUPED or stratification if appropriate | Reduces required sample size for same power |
| 9. Segment analysis plan | Define which segments to analyze post-test | Prevents data-dredging for positive sub-groups |
The Logic of A/B Testing
Why Randomization Matters
The value of A/B testing rests entirely on randomization. When users are randomly assigned to control and treatment groups, the groups are statistically equivalent on average across all variables - not just the ones you know about and can measure, but the ones you cannot see.
Random assignment is what allows you to attribute differences in outcome to the variant being tested rather than to pre-existing differences between user groups.
Without randomization, you have an observational study, not an experiment, and any number of confounding factors could explain the differences you observe. If you showed variant B to users who arrived on Tuesday and compared them to Monday users, Tuesday might have systematically different user composition.
If you showed variant B to users in a specific geography, regional differences could explain any outcome difference. Randomization eliminates these confounders in expectation.
This is why A/B testing is described as the "gold standard" of causal inference in product development contexts - it is one of the few methods that genuinely allows you to say "this change caused this outcome" rather than "this change was associated with this outcome."
The unit of randomization matters significantly. Most web experiments randomize by user (or user identifier), which is appropriate for features where the user's own experience is what we are measuring. But some experiments require randomization by other units.
Network effect experiments on social platforms, for example, must often randomize by social cluster rather than individual user, because variants can "leak" between users who are socially connected - a user in the control group may change their behavior because their friends in the treatment group changed theirs.[11]
The Hypothesis Testing Framework
The formal statistical framework underlying A/B testing is null hypothesis significance testing (NHST).
Before running the test, you specify a null hypothesis (typically: "there is no difference between variant A and variant B on the metric I care about") and an alternative hypothesis ("variant B produces a higher conversion rate than variant A").
After collecting data, you compute the probability of observing results this extreme if the null hypothesis were true - the p-value. If that probability is below your pre-set threshold (typically 0.05), you reject the null hypothesis and conclude the result is statistically significant.
What statistical significance does not tell you: whether the effect is real (significance is a probability statement about sampling variation, not a guarantee of truth), whether the effect is practically meaningful (a statistically significant 0.1% improvement in conversion may not be worth shipping), or whether your test was designed correctly.
Understanding Statistical Significance Without the Jargon
A Plain-Language Explanation
Imagine you flip a coin 20 times and get 13 heads. Is the coin biased? You cannot be certain - even a fair coin will sometimes produce 13 heads in 20 flips by chance.
But you can ask: "how likely is it to get 13 or more heads from a fair coin?" If the answer is "pretty unlikely" (less than 5% probability), you might conclude the coin is probably biased.
If the answer is "quite plausible" (more than 5% probability), you do not have strong evidence of bias.
A/B testing applies the same logic to your experiment. If variant B's conversion rate was 5.2% versus variant A's 5.0%, you ask: "how likely is this difference (or a larger one) to appear by chance if the two variants actually perform identically?" If the answer is less than 5%, you call the result statistically significant.
If the answer is more than 5%, you say you do not have sufficient evidence to conclude B is better.
The critical nuance: statistical significance tells you about evidence strength, not truth.
With a 5% significance threshold, if you run 100 A/B tests where the variants genuinely have no effect, you expect to see roughly 5 false positives - results that look significant but are actually random noise. This is the foundation of several serious problems in how A/B tests are run.
Practical vs. Statistical Significance
Large sample sizes can make tiny, inconsequential differences statistically significant. If you have ten million users in your test, a conversion rate change from 5.000% to 5.001% may reach statistical significance even though the business impact is negligible.
The question "is this statistically significant?" should always be accompanied by "is this practically meaningful?"
Practical significance is measured by effect size: how large is the actual difference, and does it matter for the decisions you need to make? A 10% relative improvement in conversion rate is typically meaningful for a product team; a 0.02% absolute improvement is typically not, even if it is statistically significant.
This distinction is particularly important for large platforms with millions of daily users - their sample sizes are so large that almost any real difference will be detectable, making effect size evaluation more important than significance testing in many decisions.
Statisticians use Cohen's d (for continuous outcomes) or relative risk ratios (for binary outcomes like conversion) to express standardized effect sizes independent of sample size. A Cohen's d of 0.2 is conventionally described as a small effect; 0.5 as medium; 0.8 as large.
In practice, most A/B tests in product development produce small effects, and the commercially meaningful threshold varies by context - a 0.5% absolute conversion improvement at Amazon's transaction volume is worth billions of dollars; the same improvement for a small e-commerce site is undetectable noise.
Common Mistakes That Invalidate A/B Tests
Peeking
Peeking - checking test results repeatedly before reaching the planned sample size and stopping early when they look significant - is one of the most prevalent and consequential mistakes in A/B testing.
The statistical validity of a p-value threshold assumes you will look at the data once, at the end of a predetermined collection period. Looking repeatedly inflates false positive rates in ways that are not intuitive.
Ramesh Johari, Leo Pekelis, and David Walsh quantified this rigorously in a 2017 paper on "always valid inference" developed while working at Optimizely.[2]
Their simulation showed that if experimenters stop as soon as a test crosses p = 0.05, the actual false positive rate is far higher than 5% - in some scenarios approaching 30% or higher depending on how many times the test is checked.
The practical solutions are: pre-determine sample size and duration, wait for both before evaluating results, or use sequential testing methods (like Bayesian approaches or always-valid confidence intervals) that are specifically designed to allow early stopping with controlled error rates.
Underpowered Tests
Running a test with insufficient sample size leads to high rates of false negatives - missing real effects. More insidiously, the effects that do pass significance thresholds in underpowered studies tend to be overestimates of the true effect (the "winner's curse" in experimentation).
Andrew Gelman and John Carlin described this problem as "Type S" errors (wrong sign) and "Type M" errors (wrong magnitude) in underpowered studies.[4]
Calculating required sample size before running a test is not optional housekeeping - it is what determines whether your results will be interpretable. The calculation requires specifying baseline conversion rate, minimum detectable effect, desired power, and significance threshold.
Evan Miller's "How Not To Run An A/B Test" and his associated calculator have become standard references in product analytics.[3]
A concrete illustration: if your baseline conversion rate is 3% and you want to detect an improvement of 0.5 percentage points (a 17% relative improvement), achieving 80% power at a 5% significance threshold requires approximately 9,000 users per variant - 18,000 total.
If your site receives 500 daily visitors and you run the test for a week, you have 3,500 total users and vastly insufficient power to detect the effect. Running the test anyway produces unreliable results regardless of what the numbers show.
Multiple Comparisons
Testing many variants simultaneously, or analyzing many different metrics for the same test, inflates the overall false positive rate. If you test ten variants simultaneously at a 5% significance threshold, the probability of at least one false positive is 1 - 0.95^10, approximately 40%.
Rigorous experimentation teams apply corrections for multiple comparisons. The Bonferroni correction divides the significance threshold by the number of comparisons, which is conservative but simple. The Benjamini-Hochberg procedure controls the false discovery rate and is less conservative for large numbers of tests.[8]
Most practically, specifying a single primary metric before the test and treating all other metrics as exploratory - not confirmatory - is the most sustainable approach.
The Novelty Effect
When users encounter a change, they often interact with it differently than they will after habituation. A new button style might attract more clicks initially simply because it is visually different - a novelty effect that fades over time.
Tests that are too short may capture this initial novelty response rather than the true long-term behavioral change.
The solution is running tests long enough to capture stable behavioral patterns - typically at least one full business week cycle to account for day-of-week effects, and ideally longer for features where the novelty effect is expected to be significant.
Sample Ratio Mismatch
A sample ratio mismatch (SRM) occurs when the proportion of users assigned to each variant does not match the intended split.
In a 50/50 test, if you end up with 48% of users in control and 52% in treatment, something has gone wrong with your randomization or logging - and your results cannot be trusted regardless of statistical significance.
SRMs can occur due to: bot traffic being unevenly distributed between variants, client-side logging that fires only after page load (missing users who bounce immediately), browser caching creating sticky variant assignment bugs, or filtering applied after assignment but before logging.
Checking for SRM before analyzing any test results is a mandatory quality check in rigorous experimentation systems.
How Tech Companies Run Experiments at Scale
Google's Experiment Infrastructure
Ron Kohavi, who has led experimentation programs at Microsoft and Google and is among the world's most published researchers on controlled experiments in industry, describes in his book Trustworthy Online Controlled Experiments the scale and sophistication of experimentation at major technology companies.[1]
Google runs tens of thousands of experiments annually across its products. The infrastructure to support this at scale - randomization systems, traffic splitting, metric calculation pipelines, statistical analysis automation, and guardrail metrics that automatically flag tests causing regressions elsewhere in the product - is itself a major engineering investment.[14]
Google's OEC (Overall Evaluation Criterion) is a composite metric combining multiple signals designed to reflect long-term user and business value, not just short-term conversion.
Critically, Google distinguishes between metrics used for individual experiment decisions and metrics used to evaluate the ranking system overall.
Behavioral signals like click-through rates and session length are used in aggregate to evaluate whether ranking changes are improvements - not to rank individual pages, which would be immediately gameable.
Kohavi has documented several counterintuitive findings from large-scale search experimentation.
In one frequently cited example, a Microsoft Bing team experimented with an ad formatting change that initially looked negative on short-term click metrics but positive on long-run revenue and user satisfaction - a result that would have been missed without long-duration holdout experiments alongside the standard short-term test.
Netflix's Experimentation Platform
Netflix has published extensively on its experimentation approach.[5] Key elements include: defining the analysis unit carefully (not always the individual user - for streaming, the "household" is sometimes more appropriate), managing the novelty effect (users respond differently to changes immediately versus after habituation), and using long-run holdout experiments to measure effects that take time to manifest.
Netflix's approach to thumbnail optimization - selecting which image to show for a given title based on user context - is one of the most widely cited examples of large-scale, high-frequency experimentation delivering meaningful business value.
The difference in play rate between the best and worst thumbnails for the same title can exceed 30% - a substantial effect discovered and quantified through systematic experimentation.
Netflix also uses a technique called CUPED (Controlled-experiment Using Pre-Experiment Data), originally developed by Deng and colleagues at Microsoft, which uses pre-experiment user behavior to reduce variance in experiment metrics.[6]
By controlling for each user's pre-experiment behavior, CUPED effectively reduces the sample size needed to achieve the same statistical power - in Netflix's published accounts, by 40 to 60 percent for some metrics.
This is a significant practical efficiency for a company running hundreds of experiments simultaneously.
Airbnb's Approach to Complex Marketplace Experiments
Airbnb's experimentation team has published work on the specific challenges of running experiments in two-sided marketplaces - platforms with both supply-side participants (hosts) and demand-side participants (guests). In a standard A/B test, you would randomly assign users to treatment and control.
But in a marketplace, a pricing change shown to a subset of guests affects the availability and pricing seen by control-group guests - because hosts respond to demand signals. This marketplace interference problem makes standard A/B test validity assumptions untenable.
Airbnb's approach involved developing new experimental designs - including switchback experiments (alternating treatment and control over time periods) and geographic clustering experiments - to isolate causal effects despite interference.[15]
Their work, published in proceedings at KDD and other conferences, has influenced how other marketplace platforms approach experimentation design.
Etsy and the Experimentation Culture
Etsy's engineering team has written about building an experimentation culture rather than merely an experimentation tool.
The technical infrastructure matters, but the organizational culture - in which product decisions are expected to be supported by experiment results, in which managers do not override data, and in which "we ran a test" is a normal part of product review - is what determines whether experimentation actually improves decisions.
Dan McKinley, previously of Etsy, gave a widely read talk arguing that experimentation culture requires organizational will as much as statistical sophistication.[9]
Building that culture means accepting that many experiments will show no effect or show a negative effect - and treating those results as valuable information rather than as failures.
A "failed" experiment that shows a proposed change is neutral or harmful is exactly as valuable as a successful one; it prevents shipping a change that would have degraded the product.
Research by Fabijan, Dmitriev, and colleagues surveying Microsoft, LinkedIn, and other large-scale experimenters found that the companies with the most mature experimentation cultures shared a common characteristic: they had normalized null results and made it organizationally safe to report them without career consequences.[7]
Companies where null results were treated as failures had higher rates of p-hacking and false positive results because researchers were incentivized to find significant results rather than truthful ones.
Bayesian vs. Frequentist Approaches
The dominant framework described above - p-values, null hypothesis testing - is frequentist. An alternative is Bayesian A/B testing, which asks a different question: given the data observed, what is the probability that variant B is better than variant A?
Bayesian approaches have several practical advantages: they produce probability statements that are more intuitive than p-values, they can incorporate prior knowledge about likely effect sizes, and some Bayesian methods (like those used by VWO and others) allow for continuous monitoring and early stopping without the false positive inflation that affects frequentist peeking.
The tradeoff is that results depend on prior assumptions, which requires care in specification.
| Dimension | Frequentist | Bayesian |
|---|---|---|
| Primary question | Is the result unlikely under the null hypothesis? | What is the probability that B is better than A? |
| Output | P-value, confidence interval | Posterior probability, credible interval |
| Early stopping | Requires sequential corrections | Some methods allow naturally |
| Prior knowledge | Not incorporated | Can incorporate |
| Interpretability | Often misunderstood | More intuitive for practitioners |
| Assumption sensitivity | Less sensitive to priors | Depends on prior specification quality |
Neither approach is universally superior. Large technology companies with strong statistical expertise often use frequentist methods with sequential corrections. Smaller teams or those without statisticians may find Bayesian approaches more interpretable.
The important thing is consistency - using the same analysis framework across experiments and not switching after seeing results.
The Replication Crisis and Its Lessons for Product Experimentation
The well-documented replication crisis in academic psychology and medicine - in which a significant proportion of published findings have failed to replicate in independent studies - has direct lessons for product experimentation.[12]
The same structural incentives that produced the replication crisis (publication bias toward positive results, p-hacking, underpowered studies, HARKing - Hypothesizing After Results are Known) are present in organizational settings where positive A/B test results lead to promotions and recognition.
John Ioannidis's seminal 2005 paper "Why Most Published Research Findings Are False" demonstrated mathematically that when studies are underpowered, prior probability of any given hypothesis is low, and researchers have flexibility in analysis choices, the majority of "positive" findings are false.[10]
His analysis applies equally to product experimentation ecosystems where these conditions hold.
The practical defense is the same in product contexts as in academic ones: pre-registration of hypotheses and analysis plans, adequate power, correction for multiple comparisons, and a culture that values null results.
Organizations that have implemented these practices - most notably major technology companies with mature experimentation platforms - report substantially higher replication rates for A/B test results compared to the estimated replication rates in academic psychology literature.
Practical Takeaways
Running a valid A/B test requires: random assignment of users to variants, a pre-defined primary metric, a sample size calculation done before the test starts, commitment to running the test until the planned sample size is reached, and a single analysis at the end rather than repeated checks.
These requirements are not bureaucratic overhead - each one corresponds to a specific way test results become untrustworthy when ignored.
Statistical significance is a starting point, not a conclusion. A result that is statistically significant may not be practically meaningful, may be the result of multiple comparisons inflation, or may be a false positive.[13]
Evaluating results requires asking whether the effect size is meaningful, whether the test was designed with adequate power, and whether the experiment was conducted without peeking.
Check for sample ratio mismatch before analyzing any test results. Verify that guardrail metrics have not degraded even when the primary metric improved. Treat segment-level analyses of test results as hypothesis-generating, not hypothesis-confirming, unless they were pre-specified.
The most valuable skill in A/B testing is not statistics - it is judgment about what to test, how to measure it honestly, and how to act on results without mistaking noise for signal.
Sources & Further Reading
- Kohavi, R., Tang, D., & Xu, Y. (2020). Trustworthy Online Controlled Experiments: A Practical Guide to A/B Testing. Cambridge University Press.
- Johari, R., Pekelis, L., & Walsh, D. (2017). "Peeking at A/B tests: Why it matters, and what to do about it." Proceedings of the 23rd ACM SIGKDD International Conference on Knowledge Discovery and Data Mining.
- Miller, E. (2010). "How not to run an A/B test." evanmiller.org.
- Gelman, A., & Carlin, J. (2014). "Beyond power calculations: Assessing Type S (sign) and Type M (magnitude) errors." Perspectives on Psychological Science, 9(6), 641-651.
- Tingley, M., et al. (2022). A/B Testing and Beyond: Improving the Netflix Streaming Experience with Experimentation and Data Science. Netflix Technology Blog.
- Deng, A., et al. (2013). "Improving the sensitivity of online controlled experiments by utilizing pre-experiment data." Proceedings of the 6th ACM International Conference on Web Search and Data Mining. (CUPED paper)
- Fabijan, A., et al. (2018). "The evolution of continuous experimentation in software product development." Proceedings of ICSE 2018.
- Benjamini, Y., & Hochberg, Y. (1995). "Controlling the false discovery rate: A practical and powerful approach to multiple testing." Journal of the Royal Statistical Society, 57(1), 289-300.
- McKinley, D. (2012). Responsible Data Science at Etsy. Etsy Engineering Blog.
- Ioannidis, J. P. A. (2005). "Why most published research findings are false." PLOS Medicine, 2(8), e124.
- Xu, Y., et al. (2015). "From infrastructure to culture: A/B testing challenges in large scale social networks." Proceedings of KDD 2015.
- Meehl, P. E. (1978). "Theoretical risks and tabular asterisks: Sir Karl, Sir Ronald, and the slow progress of soft psychology." Journal of Consulting and Clinical Psychology, 46(4), 806-834.
- Dmitriev, P., et al. (2017). "A dirty dozen: Twelve common metric interpretation pitfalls in online controlled experiments." Proceedings of KDD 2017.
- Kharitonov, E., et al. (2017). "Interventional complexity and the difficulty of online controlled experiments." Proceedings of the WWW 2017.
- Airbnb Engineering. (2019). Experimentation in a Ridesharing Marketplace. medium.com/airbnb-engineering.