
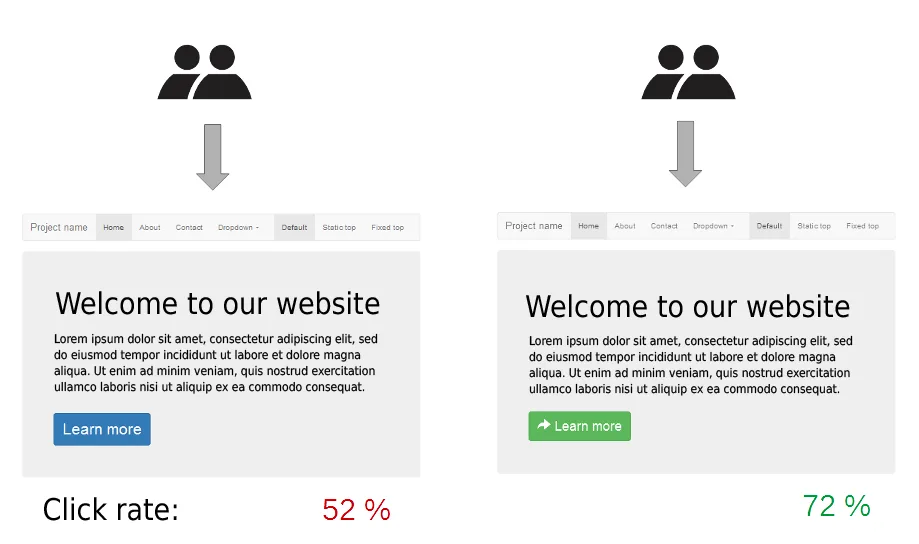
Testing: Some of the most consequential decisions in technology, marketing, and product development are now made not by executives or strategists but by experiments.
A/B testing - the practice of running controlled experiments to measure the effect of changes on user behavior - has become one of the defining analytical practices of the digital era.
Google runs over 10,000 A/B tests per year. Amazon's entire e-commerce experience is the product of continuous experimentation. Netflix has A/B tested everything from thumbnail images to the text on subscription pages.
This article explains how A/B testing works, what statistical significance actually means, the lessons from famous tests, the pitfalls that make results misleading, and when experimentation is not the right tool.
What Is A/B Testing?
A/B testing (also called split testing) is a controlled experiment in which two versions of something are shown to different randomly assigned groups of users, and measurable outcomes are compared to determine which version performs better.
The structure is simple:
- Control group (A): Users see the current version (the baseline)
- Treatment group (B): Users see the new variant being tested
- Random assignment: Users are randomly assigned to one group, ensuring the groups are comparable
- Measurement: A specific metric (click-through rate, purchase conversion, time-on-page) is tracked for both groups
- Analysis: Statistical methods determine whether any observed difference is likely to be real or due to chance
The power of A/B testing is that random assignment controls for all other variables simultaneously. If users are randomly assigned, then on average all other factors - demographics, device type, time of day, motivation - are balanced between groups.
Any measured difference in outcomes can be attributed to the one thing that varies: whether the user saw version A or version B.
"A/B testing replaces the question 'what do we think will work?' with 'what does our data show actually works?' For organizations operating at scale, this shift is the difference between decisions guided by evidence and decisions guided by whoever argues most persuasively in the conference room."
The Historical Roots of Controlled Experimentation
The logic of the controlled experiment did not originate in digital marketing. Ronald A. Fisher, working at the Rothamsted Agricultural Experimental Station in the 1920s and 1930s, developed the statistical foundations of randomized controlled trials while studying crop yields.[2]
Fisher's 1935 book The Design of Experiments established the principles of randomization, replication, and blocking that underpin modern experimental methodology.
The application of controlled experimentation to marketing traces to direct mail testing in the mid-20th century, where catalog companies would send different versions to different zip codes and compare response rates.
What the internet changed was scale and speed: instead of weeks to accumulate responses from thousands of households, digital products can accumulate millions of user interactions within hours.
This compression of the feedback loop transformed experimentation from an occasional research exercise into a continuous operational practice.
The term "A/B testing" became standard in digital product development around 2000-2005, coinciding with the rise of large-scale web platforms.
By 2012, Ron Kohavi and colleagues at Microsoft published influential research documenting how even experienced engineers' intuitions about what would improve products were wrong more than half the time - a finding that made the business case for systematic experimentation difficult to dismiss.[3]
How A/B Testing Works: The Process Step by Step
Step 1: Define the Hypothesis
Every A/B test begins with a specific, falsifiable hypothesis. Not "let's try a different button color" but: "Changing the CTA button from gray to green will increase the click-through rate on the product page because green is associated with action and has higher contrast on our current design."
A well-formed hypothesis specifies:
- What is being changed
- What metric you expect to change
- The direction of the expected change
- The reasoning behind the expectation
The reasoning matters because it forces clarity about the mechanism of change. If the test confirms the hypothesis, the reasoning either holds or you have coincidental confirmation. If it disconfirms the hypothesis, the reasoning guides where to look next.
Step 2: Identify the Metric
Choose one primary metric - the number the experiment is designed to move. Secondary metrics can be tracked to understand effects, but the test outcome should be judged against the primary metric only. Testing against multiple metrics simultaneously inflates the probability of false positives.
Common primary metrics include:
- Conversion rate (percentage of users who complete a desired action)
- Click-through rate
- Revenue per user
- Retention rate (percentage of users who return)
- Task completion rate in UX testing
Secondary or guardrail metrics track potential negative side effects. A test might increase short-term click-through rate while decreasing engagement depth - monitoring both reveals whether a surface improvement is trading one metric for another.
Kohavi, Tang, and Xu (2020) describe guardrail metrics as essential infrastructure for responsible experimentation at scale.[1]
Step 3: Calculate Required Sample Size
Before starting the test, calculate how many users are needed to reliably detect the expected effect size. This depends on:
- The baseline conversion rate (current performance)
- The minimum detectable effect (how small a difference you care about)
- The desired statistical power (typically 80%, meaning 80% probability of detecting a real effect if one exists)
- The significance level (typically 0.05, or 5% false positive rate)
Online calculators (Evan Miller's sample size calculator is a standard reference) automate this calculation. Running a test without pre-calculating sample size is one of the most common sources of misleading results.
For example: if your baseline conversion rate is 3% and you want to detect an improvement to 3.5% (a 16% relative improvement), you need approximately 33,000 users per group at 80% power and 95% confidence. A test stopped at 5,000 users would likely miss this effect entirely.
Step 4: Run the Test
Deploy the variants, ensure random assignment is working correctly, and let the test run. The test should run for at least one full business cycle - typically one to two weeks - to account for day-of-week effects. Many behavioral patterns on digital products vary significantly between weekdays and weekends.
Step 5: Analyze Results
When the pre-specified sample size is reached, analyze the data. The primary question: is the observed difference between A and B statistically significant at your predetermined threshold?
Statistical Significance and P-Values: Explained Without Jargon
The most consistently misunderstood concept in A/B testing is statistical significance.
Start with this scenario: you run an A/B test on a landing page. Group A (1,000 users) converts at 4.0%. Group B (1,000 users, seeing the new design) converts at 4.4%. Group B is higher - but is that difference real, or is it just random variation?
Statistical significance is the answer to that question. It quantifies how likely the observed difference is to occur by chance if there were actually no true difference between the designs.
Understanding the P-Value
A p-value is the probability of observing a result at least as extreme as the one measured, assuming the null hypothesis (no real difference) is true.
- P-value of 0.05: There is a 5% probability of seeing this large a difference by chance if the variants are actually identical. Most A/B testing frameworks treat p < 0.05 as the threshold for claiming significance.
- P-value of 0.01: Only 1% probability the result is due to chance. Stronger evidence.
- P-value of 0.40: A 40% chance the result is due to random variation. Essentially no evidence of a real effect.
What p-values do not mean: A p-value of 0.05 does not mean there is a 5% chance the result is a fluke. It does not tell you the probability that the hypothesis is true.
These are among the most common misinterpretations, documented in a widely cited 2016 statement from the American Statistical Association (Wasserstein & Lazar, 2016) warning against misuse of the p-value.[5]
The Confidence Level
95% confidence means: if you ran this experiment 100 times under identical conditions, you would observe a result this extreme or more extreme in fewer than 5 of those 100 experiments, assuming no true effect exists.
| Observed Conversion Rate | Control | Variant | Difference | P-value | Significant at 95%? |
|---|---|---|---|---|---|
| Example 1 | 4.0% | 4.4% | +0.4% | 0.23 | No |
| Example 2 | 4.0% | 5.2% | +1.2% | 0.03 | Yes |
| Example 3 | 4.0% | 4.8% | +0.8% | 0.08 | No (borderline) |
| Example 4 | 4.0% | 3.5% | -0.5% | 0.18 | No |
| Example 5 | 4.0% | 6.1% | +2.1% | 0.001 | Yes (strong) |
The first example looks like an improvement but is not statistically distinguishable from chance with these sample sizes. The third is borderline - neither clearly significant nor clearly not. Extending the test to collect more data is the appropriate response to borderline results, not interpreting them as a win.
Statistical Power
Statistical power is the probability that a test will detect a real effect if one exists. A test with 80% power will miss real effects 20% of the time (producing a false negative). Tests with too-small samples have low power, producing high false negative rates - you conclude "no effect" when an effect actually exists.
The relationship between sample size, effect size, power, and significance level is fundamental. Increasing power requires either larger sample sizes or larger expected effect sizes.
This tradeoff explains why testing very small changes (improving a CTA button's copy by a word) requires far more users than testing large changes (redesigning an entire checkout flow).
The False Discovery Rate Problem
When organizations run hundreds of A/B tests simultaneously, the statistical properties of their testing program matter beyond any individual test. If you run 100 tests at p < 0.05 significance, you expect approximately 5 false positives even if none of the tested changes actually work.
The false discovery rate - the proportion of claimed positive results that are actually noise - rises as the number of tests increases without corresponding increases in sample size or significance thresholds.
Ioannidis (2005) estimated that most published research findings are false for similar reasons in academic research; the same logic applies to organizational A/B testing programs.[6]
Bonferroni correction and false discovery rate adjustment (Benjamini & Hochberg, 1995) are statistical techniques for managing this problem in multi-test programs.[7]
Famous A/B Tests: Real Examples and What They Proved
Google's 41 Shades of Blue
In 2009, Google's design team was debating which shade of blue to use for hyperlinks in Gmail and Google Toolbar. Rather than let designers or executives decide, Google ran an A/B test across 41 shades of blue - each variant served to approximately 1% of users.
The winning shade, determined by click-through rates across millions of users, was estimated to generate an additional $200 million in annual advertising revenue by marginally increasing engagement with ads.
The test was controversial internally - designer Doug Bowman left Google partly in protest of what he described as "data over design" - but it illustrated the commercial value of rigorous experimentation even on decisions that seem purely aesthetic.
It also raised a legitimate counterargument: when a company runs thousands of tests optimizing marginal engagement, the cumulative effect on user experience may not align with any single person's intent.
Obama 2008 Campaign: Sign-Up Page
The Barack Obama 2008 presidential campaign ran A/B tests on its fundraising and sign-up page that became a defining case study in digital marketing. Testing different combinations of imagery (family photo vs. video still), button text ("Sign Up" vs.
"Learn More" vs. "Join Us Now"), and page layouts, the campaign found combinations that increased sign-up conversion rates by approximately 40%. Given the donation rates that followed sign-ups, the team estimated this generated approximately $75 million in additional donations.
The test demonstrated that seemingly minor copy and design changes can have large absolute effects at scale. It also contributed to A/B testing becoming standard practice in political digital operations, a development with its own implications for how political persuasion is tested and optimized.
Amazon: Continuous Experimentation at Scale
Amazon does not publicize specific A/B tests, but the company has described its experimentation culture in detail. Amazon runs tens of thousands of A/B tests annually across its e-commerce platform, logistics systems, and advertising products.
Its approach uses automated experimentation platforms that allow hundreds of product teams to run concurrent tests without central coordination.
One well-known decision from Amazon's early years: the company tested adding customer reviews to product pages - a feature that many executives resisted, fearing negative reviews would hurt sales. The test showed the opposite: reviews increased conversion because they built buyer confidence.
The experiment overrode the intuition of senior leaders with direct measurement of customer behavior.
Amazon's scale also enables detection of much smaller effects than most organizations can study. A 0.1% improvement in conversion across billions of monthly transactions represents enormous revenue. This amplification effect means experimentation programs at internet scale reward even incremental improvements.
Netflix: Thumbnail Optimization
Netflix has published research and talks detailing its extensive use of A/B testing for content presentation. Thumbnail images for the same movie or show are tested across user segments to find which image maximizes play rate.
Netflix's 2019 research publication described how personalized artwork - different thumbnail images shown to different users based on their viewing history - increased content engagement meaningfully across its library.[8]
The research also demonstrated a subtler finding: users who clicked on a title based on a thumbnail that misrepresented the content were more likely to abandon the show early.
Optimizing purely for clicks without measuring downstream engagement produced locally winning tests that degraded overall satisfaction. This illustrates the importance of tracking secondary metrics and measuring outcomes over longer time horizons.
Common A/B Testing Mistakes and Pitfalls
Peeking: Stopping When Results Look Good
The most common and damaging A/B testing error is peeking - stopping the test early when you observe a significant-looking result before reaching the predetermined sample size.
Because any test will show noise around its true effect during early data collection, a result that looks significant at Day 3 often reverts to insignificance by Day 14. Stopping when you like what you see massively inflates the false positive rate.
Analysis by Evan Miller (2010) showed that peeking at results after every day and stopping when p < 0.05 produced false positive rates approaching 25% - far higher than the implied 5%.[4]
Sequential testing methods (such as the mSPRT framework developed at Optimizely) provide statistical approaches to continuous monitoring that maintain valid error rates, but they require different mathematical frameworks than standard frequentist significance testing.[9]
Multiple Comparisons Problem
Running simultaneous tests against multiple metrics, or testing multiple variants simultaneously against one control without correcting for multiple comparisons, inflates the probability of false positives. If you test against 20 metrics at p < 0.05 significance, you expect one false positive by chance even with no real effects.
The solution is to pre-register a single primary metric, apply Bonferroni correction when multiple comparisons are unavoidable, and treat secondary metric results as exploratory rather than confirmatory.
Novelty Effect
Users may engage with a new design element simply because it is new - not because it is better. An A/B test run over one day may show inflated results for the variant that will revert once novelty wears off.
Running tests for at least one to two weeks, and checking whether the variant's lead is stable over time, helps identify novelty effects. For major redesigns, the novelty period may be longer.
Non-Representative Traffic
Tests run on specific traffic segments (such as users who arrived through a single marketing channel) may not generalize to the overall user population. Misattributed causality from non-representative samples is a persistent problem in A/B testing.
A related problem is survivorship bias in sample selection: if the test is deployed only to users who have already passed certain engagement thresholds, results may not generalize to new users who are most likely to be affected by onboarding changes.
Simpson's Paradox
Simpson's paradox occurs when a trend appears in several subgroups of data but reverses or disappears when the data is aggregated. A variant may appear to win overall while actually losing in every individual user segment, because segment sizes differ between control and treatment.
Segmented analysis can reveal this, but it is frequently missed.
A classic example: a checkout flow redesign might appear to increase overall conversion by attracting more mobile users to the treatment group, while actually converting at a lower rate on both desktop and mobile when examined separately. The overall win is an artifact of composition, not a real improvement.
Interaction Effects Between Concurrent Tests
When multiple tests run simultaneously, variants in different tests may interact. A navigation change in Test A and a product page change in Test B may produce outcomes together that neither produces alone.
Most A/B testing platforms assume independence between concurrent tests; this assumption fails when changes affect the same user journey. Organizations running many concurrent tests should monitor for anomalous patterns that may indicate interactions.
When Not to A/B Test
A/B testing is a powerful tool with real limitations. There are circumstances where it is not the right approach:
When sample sizes are too small: An e-commerce site with 200 visitors per day cannot run meaningful A/B tests on conversion rate changes of a few percentage points. The test would take years to reach significance. User research, qualitative analysis, and expert review are more appropriate in low-traffic environments.
When the change is too consequential: If one variant carries serious risk - a major price change, a safety-relevant feature, a significant brand commitment - you cannot ethically or commercially expose half your users to potential harm for experimental purposes.
When the decision is urgent: A/B testing takes time. Emergency fixes, regulatory responses, or decisions with immediate deadlines cannot wait for experimental validation.
When the effect is long-term: A/B testing typically measures short-term behavioral changes. Features that affect long-term retention, lifetime customer value, or user health require longer observational periods than most A/B tests run.
A feature that depresses short-term engagement but increases long-term satisfaction - such as reducing notification frequency - may appear to "lose" in a standard two-week A/B test.
When you already have strong evidence: If the change is supported by extensive prior research, user interviews, and theoretical reasoning, running a lengthy A/B test may delay a clearly beneficial decision. Accessibility improvements, for example, should not be blocked pending A/B test confirmation.
When qualitative understanding is the goal: A/B testing tells you whether one variant outperforms another. It does not tell you why.
When the goal is to understand user mental models, identify friction in a complex flow, or generate hypotheses for future tests, user research methods - interviews, usability testing, think-aloud sessions - provide information that A/B tests cannot.
Beyond A/B Testing: Multivariate Testing and Bandit Algorithms
Multivariate Testing
Multivariate testing tests multiple elements simultaneously (e.g., headline, image, button color, and layout all varied at once) to understand interaction effects. It requires much larger sample sizes than A/B tests but can identify combinations that no single-variable test would reveal.
A factorial multivariate test with 3 variables, each with 2 variants, requires 8 cells (2^3) and corresponding increases in sample size. For most organizations, meaningful multivariate testing requires extremely high traffic volumes.
Multi-Armed Bandit Algorithms
Multi-armed bandit algorithms are an alternative to traditional A/B testing that continuously allocates more traffic to better-performing variants as data accumulates, rather than waiting until a pre-specified sample size is reached.
They are more efficient in terms of user experience (fewer users exposed to worse variants) but make statistical interpretation more complex.
The tradeoff between exploration (continuing to send traffic to all variants to gather reliable data) and exploitation (concentrating traffic on the current best variant) is the central problem bandit algorithms solve.
They are widely used in online advertising, recommendation systems, and clinical trials where the cost of exposing subjects to inferior treatments is high.
Thompson Sampling, Upper Confidence Bound (UCB), and Epsilon-Greedy are common bandit strategies. Each makes different assumptions about the tradeoff between learning rate and regret minimization.
Bayesian A/B Testing
An alternative statistical framework to the frequentist approach described above, Bayesian A/B testing expresses results as probability distributions over possible effect sizes rather than binary significant/not-significant conclusions.
Bayesian approaches allow more natural interpretation ("there is a 94% probability that variant B outperforms variant A") and can be updated continuously as data accumulates without the peeking problem that affects frequentist tests.
Bayesian methods have gained adoption in digital experimentation platforms, including VWO and AB Tasty, as alternatives to traditional p-value-based approaches.
Building an Experimentation Culture
The organizations that benefit most from A/B testing are not necessarily those with the most sophisticated statistical frameworks - they are those that have built cultural infrastructure to support systematic experimentation.[10]
Kohavi, Tang, and Xu (2020) identify several characteristics of mature experimentation cultures: leadership willingness to accept results that contradict organizational intuition; clear ownership of experimentation infrastructure; a documented experiment backlog informed by qualitative research; and consistent practice of retrospective analysis comparing test predictions to outcomes.
The value of a retrospective is underappreciated. Tracking how often teams' pre-test predictions matched actual outcomes improves calibration over time.
Microsoft's research showed that teams who systematically reviewed prediction accuracy improved their ability to anticipate experimental outcomes - and became more disciplined about which hypotheses were worth testing.
"After years of running experiments, we've found that only about 1 in 3 ideas that engineers and product managers are sure will improve the product actually do improve it.
Most changes make no difference, and some make things worse." - Ron Kohavi, Diane Tang, and Ya Xu, Trustworthy Online Controlled Experiments, Cambridge University Press, 2020
This finding is not discouraging - it is the entire argument for experimentation. If expert intuition were reliable, you would not need experiments. The 30-70 hit rate is precisely why systematic testing generates returns: you stop shipping changes that feel good but do not work, and you ship the ones that do.
Key Takeaways
A/B testing is one of the most valuable tools for evidence-based decision-making, but its value depends entirely on using it correctly.
| Principle | Why It Matters |
|---|---|
| Random assignment | Makes the groups comparable; without it, you cannot attribute differences to the treatment |
| Pre-specify sample size | Prevents stopping early and inflating false positive rates |
| One primary metric | Avoids the multiple comparisons problem |
| Run for at least two weeks | Accounts for day-of-week effects and novelty decay |
| No peeking | Interim looks without adjustment destroy statistical validity |
| Track guardrail metrics | Catches cases where a win on one metric comes at cost to another |
| Segment results | Aggregate results can hide conflicting effects in subgroups |
| Document predictions | Comparing predictions to outcomes improves future calibration |
When used rigorously, A/B testing transforms product and marketing decisions from exercises in persuasion - whoever has the best argument wins - into exercises in measurement - whatever the data shows wins. That is a significant organizational advantage when deployed with appropriate statistical discipline.
Sources & Further Reading
- Kohavi, R., Tang, D., & Xu, Y. (2020). Trustworthy Online Controlled Experiments: A Practical Guide to A/B Testing. Cambridge University Press.
- Fisher, R. A. (1935). The Design of Experiments. Oliver and Boyd.
- Kohavi, R., Longbotham, R., Sommerfield, D., & Henne, R. M. (2009). "Controlled experiments on the web." Data Mining and Knowledge Discovery, 18(1), 140-181.
- Miller, E. (2010). "How not to run an A/B test." Evan Miller blog, evanmiller.org.
- Wasserstein, R. L., & Lazar, N. A. (2016). "The ASA statement on p-values: Context, process, and purpose." The American Statistician, 70(2), 129-133.
- Ioannidis, J. P. (2005). "Why most published research findings are false." PLOS Medicine, 2(8), e124.
- Benjamini, Y., & Hochberg, Y. (1995). "Controlling the false discovery rate: A practical and powerful approach to multiple testing." Journal of the Royal Statistical Society: Series B, 57(1), 289-300.
- Netflix Technology Blog. (2019). "Artwork personalization at Netflix." netflixtechblog.com.
- Optimizely. (2015). "Peeking at A/B tests: Why it matters, and what to do about it." optimizely.com.
- Eisenberg, B., & Eisenberg, J. (2008). Always Be Testing: The Complete Guide to Google Website Optimizer. Wiley.