This guide breaks down how compound interest actually works, why it grows your money faster the longer you leave it, and how to put it to work in your own savings and investments, with real dollar figures so you can see the effect for yourself.
Compound interest works by calculating interest on both your original principal and all the interest that has already accumulated, so the amount earning interest grows larger with every period.
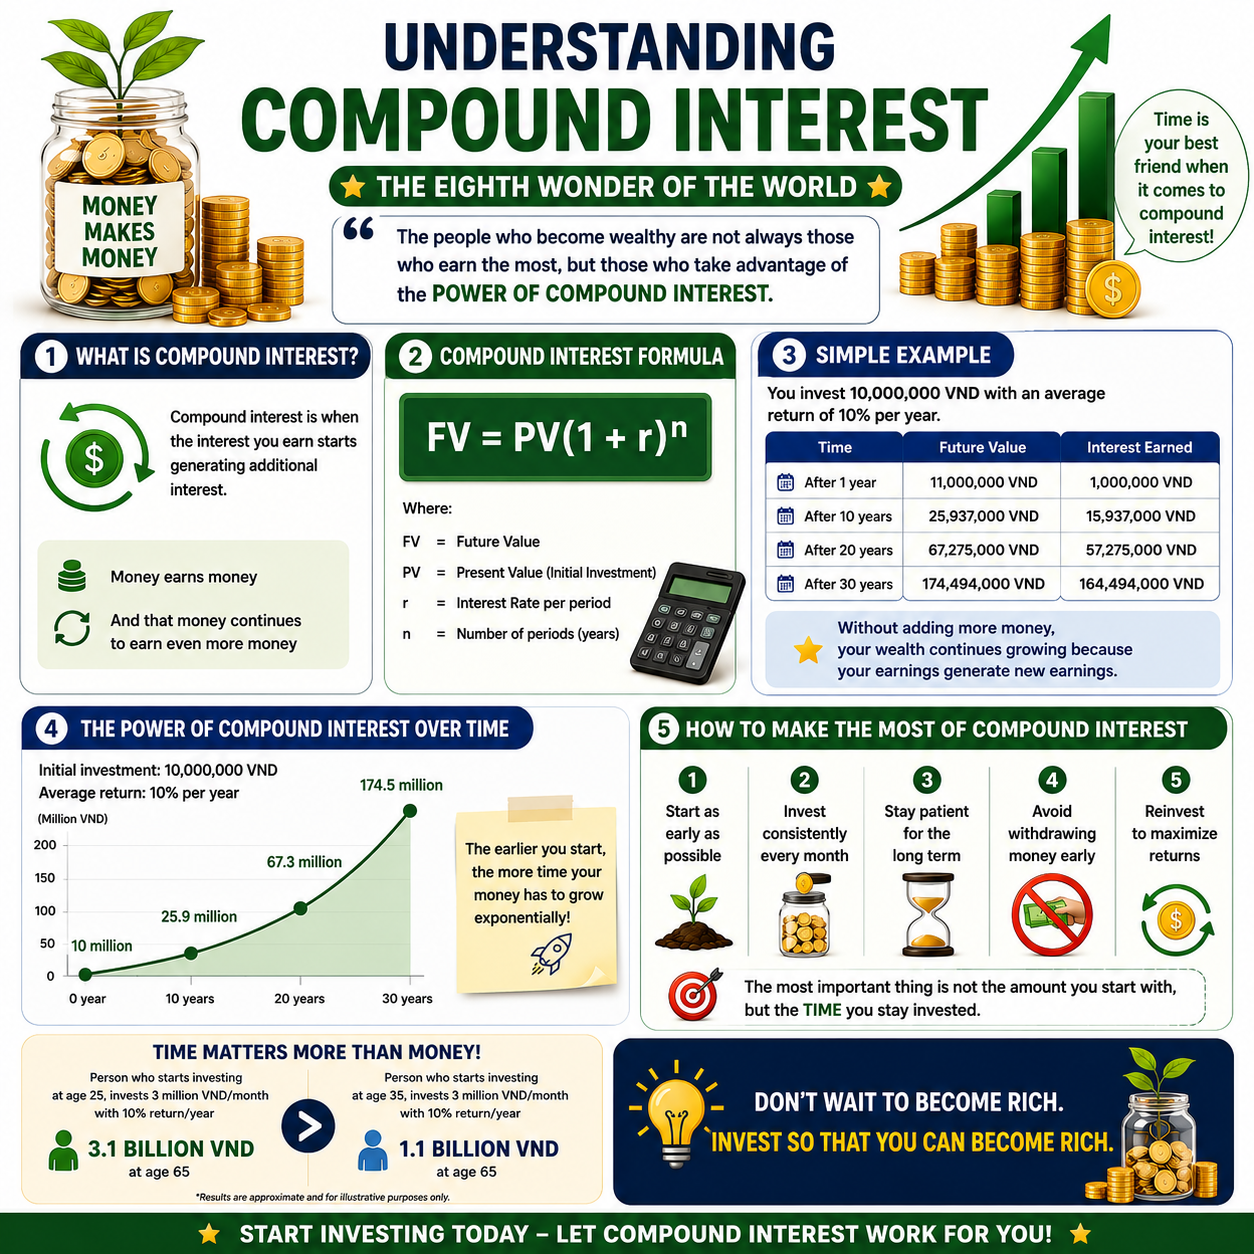
Albert Einstein reportedly called it the 'eighth wonder of the world,' and while the attribution is apocryphal, the sentiment is apt. At a 7% annual return, $10,000 invested today becomes $76,123 in 30 years without a single additional contribution.
The same $10,000 under simple interest would produce just $31,000. That difference, $45,000, is the compounding effect at work, and it explains why the concept sits at the foundation of virtually every serious discussion about long-term wealth building.
The mechanism is straightforward: interest earned in one period is added to the principal, and the new, larger total then earns interest in the next period. This creates a feedback loop. Early in the process, the loop is barely perceptible.
Decades later, it becomes overwhelming. Understanding this dynamic, not just intellectually but viscerally, transforms how you approach saving, investing, and debt.
This article walks through the formula, the Rule of 72, concrete examples across different time horizons, why starting early has an outsized effect that cannot be made up for later, and why the same mechanism that builds wealth can devastate borrowers who ignore high-interest debt.
"Compound interest is the eighth wonder of the world. He who understands it, earns it; he who does not, pays it.", attributed to Albert Einstein
Key Definitions
Principal: The original sum of money invested or borrowed, before any interest is applied.
Interest rate: The percentage of the principal charged or earned per period (typically expressed annually as APR or annually compounding as APY).
Compounding frequency: How often interest is calculated and added to the principal, annually, monthly, daily, or continuously.
APY (Annual Percentage Yield): The effective annual return after accounting for compounding frequency. A 6% rate compounded monthly produces an APY slightly above 6%.
Doubling time: The number of periods required for a principal to double at a given compound growth rate, approximated by the Rule of 72.
Simple interest: Interest calculated only on the original principal, never on accumulated interest. Produces linear rather than exponential growth.
Real rate of return: The nominal return adjusted for inflation; the figure that matters for actual purchasing-power growth.
Time value of money: The foundational financial principle that a dollar today is worth more than a dollar in the future, because today's dollar can be invested and allowed to compound.
The Compound Interest Formula
Breaking Down the Equation
The standard compound interest formula is:
A = P(1 + r/n)^(nt)
Where:
- A = the future value (what you end up with)
- P = the principal (starting amount)
- r = annual interest rate as a decimal (6% = 0.06)
- n = number of compounding periods per year
- t = number of years
To see this in action, consider $5,000 invested at 7% annual interest, compounded monthly, for 25 years:
A = 5000 x (1 + 0.07/12)^(12 x 25) A = 5000 x (1.005833)^300 A = 5000 x 5.8045 A = approximately $29,022
The original $5,000 grew nearly sixfold without any additional contributions.
Simple Interest vs. Compound Interest: A Side-by-Side Comparison
The difference between simple and compound interest is not obvious in year one. After a single year, $10,000 at 7% simple interest earns $700; at 7% compound interest, it also earns $700. The divergence is imperceptible at first and then dramatic over decades.
Under simple interest, the formula is A = P(1 + rt). Your $10,000 at 7% for 30 years becomes $10,000 x (1 + 0.07 x 30) = $31,000. The growth is entirely linear.
Under compound interest (annual compounding), $10,000 at 7% for 30 years becomes $76,123. The extra $45,123 is the compounding effect, interest earning interest, year after year.
Siegel (2014) in Stocks for the Long Run describes this as "the miracle of compounding returns," noting that the entire history of long-run equity wealth is built on this single mechanism operating over decades.
Compounding Frequency Matters, But Less Than You Think
The more frequently interest compounds, the higher the effective return. Annual compounding at 6% produces an APY of exactly 6%. Monthly compounding at 6% nominal rate produces an APY of about 6.17%. Daily compounding produces an APY of about 6.18%.
At moderate interest rates over moderate timeframes, the difference between daily and annual compounding is relatively small. What matters far more is the interest rate itself and the time horizon.
For savings accounts and bonds, compounding frequency is worth understanding. For long-term investment portfolios, the distinction between daily and monthly compounding is trivial compared to the impact of returns and time.
The Continuous Compounding Special Case
At the mathematical limit, compounding infinitely frequently, the formula becomes:
A = Pe^(rt)
Where e is Euler's number (approximately 2.71828). Continuously compounded interest is used in some financial models and derivatives pricing.
At 6% for 10 years, the continuous compounding result is $10,000 x e^(0.6) = $18,221, versus $17,908 for annual compounding, a small difference that illustrates why frequency matters far less than rate and time.
Growth of $10,000 at Different Return Rates
The following table shows how $10,000 grows over time under different compounding return rates (annual compounding, no additional contributions).
| Years | 4% | 6% | 7% | 8% | 10% |
|---|---|---|---|---|---|
| 5 | $12,167 | $13,382 | $14,026 | $14,693 | $16,105 |
| 10 | $14,802 | $17,908 | $19,672 | $21,589 | $25,937 |
| 20 | $21,911 | $32,071 | $38,697 | $46,610 | $67,275 |
| 30 | $32,434 | $57,435 | $76,123 | $100,627 | $174,494 |
| 40 | $48,010 | $102,857 | $149,745 | $217,245 | $452,593 |
The difference between 6% and 10% at 40 years is more than $350,000 on a $10,000 investment, illustrating why even small differences in long-term return rates matter enormously.
The Rule of 72
A Mental Shortcut for Doubling Time
The Rule of 72 is one of the most useful approximations in personal finance. Divide 72 by the annual interest rate to estimate the number of years required to double your money:
- At 4%: doubles in approximately 18 years (72 / 4)
- At 6%: doubles in approximately 12 years
- At 8%: doubles in approximately 9 years
- At 10%: doubles in approximately 7.2 years
- At 12%: doubles in approximately 6 years
The rule is an approximation, at very low rates and very high rates it becomes less accurate, but for the 3-12% range relevant to most investment and debt scenarios, it is remarkably precise.
The underlying mathematics is a simplification of the exact formula t = ln(2) / ln(1 + r). Because ln(2) is approximately 0.693 and the approximation ln(1 + r) ≈ r holds reasonably well for small r, the formula simplifies to t ≈ 0.693 / r, which rounds to 72 / (r expressed as a percentage).
For higher rates (above about 15%), 72 underestimates the actual doubling time; some practitioners use 70 or 69.3 for these cases.
Using the Rule for Debt
The Rule of 72 is equally useful for understanding how debt grows. A credit card with an 18% annual interest rate will double the balance every four years (72 / 18 = 4) if no payments are made. A payday loan charging 400% APR, not uncommon, would double the balance in less than 2 months.
This framing makes the cost of carrying high-interest debt viscerally clear in a way that percentage rates alone often do not.
The Consumer Financial Protection Bureau (CFPB, 2023) reports that the average American credit card holder carries approximately $5,733 in revolving debt.
At an average APR of approximately 22% (the Federal Reserve's reported average for 2024), this balance would grow to over $11,000 in four years with no payments, purely through compounding.
The Rule Applied to Inflation
The Rule of 72 applies symmetrically to inflation and the erosion of purchasing power. At 3% inflation, purchasing power halves in approximately 24 years. At 7% inflation, experienced in the United States in 2021-2022, purchasing power would halve in approximately 10 years.
This framing helps clarify why cash savings parked in low-yield accounts during inflationary periods do not merely stagnate; they lose real value at a compounding rate.
Real Examples: 10, 20, and 30 Years
$10,000 Invested at 7% Annual Return
After 10 years: $19,672 (nearly doubled)After 20 years: $38,697 (nearly quadrupled)After 30 years: $76,123 (more than 7.5x)After 40 years: $149,745 (nearly 15x)
Notice what happens between years 20 and 30: the balance grows by $37,426 in a single decade. Between years 30 and 40, it grows by $73,622. The absolute dollar gains in each successive decade are roughly double the previous decade. This is the visual signature of exponential growth, the curve steepens sharply over time.
Monthly Contributions Accelerate Everything
Adding regular contributions transforms the picture dramatically. Consider contributing $500 per month at 7% annual return:
After 10 years: ~$86,000 (contributed $60,000)After 20 years: ~$260,000 (contributed $120,000)After 30 years: ~$600,000 (contributed $180,000)
After 30 years, $420,000 of that $600,000 balance is pure compound growth. You contributed 30 cents for every dollar you ended up with.
Thaler and Benartzi (2004), in their landmark study of behavioral savings programs published in the Journal of Political Economy, found that even modest increases in automatic savings rates produce dramatically different lifetime outcomes, primarily because the additional contributions have more years to compound.
The $500-Per-Month vs. the Lump-Sum Question
A common planning question is whether it is better to invest a lump sum immediately or spread the same total over time. Mathematically, lump-sum investing outperforms dollar-cost averaging approximately two-thirds of the time, because markets trend upward on average and a lump sum has more time in the market.
Vanguard Research (2012) analyzed lump-sum versus 12-month dollar-cost averaging across US, UK, and Australian markets and found that lump-sum investing outperformed roughly 67% of the time, by an average of 2.3 percentage points. The compounding advantage of early deployment is the cause.
However, for regular savers without a lump sum, the lesson is that any regular contribution, regardless of market timing, produces strong results through compound growth.
Automating contributions removes the behavioral temptation to wait for the "right" moment, which behavioral economics research has shown leads to underinvestment (Thaler and Benartzi, 2004).
The S&P 500 as a Real-World Benchmark
The US stock market, as measured by the S&P 500, has returned approximately 10% per year on average before inflation and roughly 7% after inflation over long historical periods.
Ibbotson and Sinquefield (1976), in their foundational study published in the Journal of Business, documented that US large-cap equities produced annualized real returns of approximately 6.9% from 1926 to 1974, a finding that has been substantially confirmed by subsequent decades of data.
These are averages with significant year-to-year volatility, individual years have ranged from -38% to +34%, but the long-term compounding effect has been substantial.
An investment of $10,000 in the S&P 500 at the start of 1993 would have grown to approximately $200,000 by 2023, assuming dividends reinvested, according to Federal Reserve Bank of St. Louis data (FRED, 2024).
Siegel (2014) notes that reinvested dividends have historically accounted for over 40% of total equity returns, underscoring the role of compounding in equity wealth-building: dividends paid out and not reinvested reduce the compounding base, and over decades, this omission is enormously costly.
Why Starting Early Matters Enormously
The Early Starter vs. the Late Starter
No illustration of compound interest is more powerful than comparing someone who starts investing young and stops versus someone who starts later and contributes for much longer.
Consider two investors, both earning 8% annual returns:
Investor A (Early Starter):
- Invests $5,000 per year from age 22 to 32 (10 years, $50,000 total)
- Stops contributing at 32
- Leaves the money invested until age 62
Investor B (Late Starter):
- Waits until age 32 to start
- Invests $5,000 per year from age 32 to 62 (30 years, $150,000 total)
Result at age 62:
- Investor A: approximately $787,000
- Investor B: approximately $611,000
Investor A contributed one-third as much money and still ends up with more. The decade of early compounding from ages 22 to 32 generates a lead that 30 years of later contributions cannot overcome. This is not an argument for reckless early-career investing, it is a demonstration of how dramatically time horizon affects outcomes.
The Opportunity Cost of Waiting
Every year of delay has a compounding cost. A 25-year-old who delays investing by one year does not just lose one year's contribution. They lose that contribution plus all the compound growth that contribution would have generated over the next 40 years.
At 7% for 40 years, $5,000 becomes $74,872. One year of procrastination costs not $5,000 but the entire future value of that $5,000.
Financial planners often frame this as: the best time to start investing was 10 years ago. The second best time is today.
The Psychological Challenge: Present Bias
The behavioral economics literature identifies present bias as the primary obstacle to early investing. Present bias is the tendency to overweight immediate rewards and costs relative to future ones, a form of time inconsistency in preferences.
Laibson (1997), in a widely cited paper in the Quarterly Journal of Economics, demonstrated that present-biased preferences cause people to save far less than their own long-run preferences would dictate, even when they recognize the compounding logic intellectually.
The practical implication: the decision to start investing early must often be made automatic and effortless, so that present bias has no decision point to exploit.
Thaler and Benartzi's "Save More Tomorrow" program, tested with corporate employees, found that automatic enrollment with automatic escalation of contribution rates produced dramatic increases in retirement savings, with minimal resistance, because the increases never required an active opt-in decision.
The Employer Match as Guaranteed Compounding
For workers with access to a 401(k) plan with employer matching, the match represents an immediate, risk-free return before any market gains. A 50% match on contributions up to 6% of salary is equivalent to a 50% instant return on those dollars.
Combined with subsequent compounding, employer-matched contributions are among the highest-return financial instruments available to ordinary workers.
Bogle (2007) in The Little Book of Common Sense Investing emphasizes that capturing the full employer match before any other investment decision is the single highest-priority action for any retirement saver.
Compound Interest on Debt
When Compounding Works Against You
The same mechanism that builds wealth in an investment account destroys it when applied to debt. Credit cards typically compound daily, your balance at the end of each day has interest calculated on it, that interest is added to the principal, and the next day's interest is calculated on the new, slightly larger balance.
Consider a $5,000 credit card balance at 20% APR, with no payments made:
After 1 year: approximately $6,107After 3 years: approximately $9,085After 5 years: approximately $13,516After 10 years: approximately $36,611
That final figure, $36,611 from an original $5,000 balance, should make the danger clear. Anyone carrying high-interest debt is running compound interest in reverse: the formula still works perfectly, but the growth is working against net worth rather than for it.
The Minimum Payment Trap
Credit card minimum payments are structured to extend the compounding advantage for card issuers. A common minimum payment is 1% of the balance plus current-month interest, which is often only slightly above the interest charged.
Making only minimum payments on a $5,000 balance at 20% APR extends repayment to approximately 29 years and results in total interest payments of over $7,000, more than the original balance.
The CFPB (2023) is required under the Credit CARD Act to include on monthly statements exactly how long it will take to pay off a balance making only minimum payments, precisely because few borrowers grasp the compounding dynamic intuitively.
Prioritizing High-Interest Debt
From a purely mathematical perspective, paying off a credit card charging 20% annual interest is equivalent to earning a guaranteed 20% return on that money. No index fund, bond, or savings account reliably provides a 20% risk-adjusted return.
This is why most financial planners recommend paying off high-interest debt before investing in anything other than tax-advantaged employer matching contributions.
The mathematical priority order:
- Capture employer 401(k) match (immediate 50-100% return)
- Pay off debt with interest rates above approximately 6-7%
- Contribute to tax-advantaged investment accounts
- Invest in taxable accounts
Ramsey (2013) in The Total Money Makeover popularized the "debt snowball" method, paying off the smallest debt balance first regardless of interest rate, for psychological momentum. The mathematically optimal strategy, the "debt avalanche", pays off the highest-interest debt first.
Both approaches work; the avalanche minimizes total interest paid; the snowball may be more behaviorally sustainable for people motivated by quick wins.
Student Loans and Deferred Interest
Student loans illustrate another compound interest trap: capitalization of deferred interest. During deferment periods, interest often continues to accrue on an unsubsidized loan. When the deferment ends, that accrued interest is capitalized, added to the principal, and future interest is then charged on the new, larger balance.
A borrower who graduates with $30,000 in unsubsidized loans might find they owe $35,000 by the time repayment begins, and every future payment is calculated against that higher base.
The US Department of Education (2023) estimates that a borrower with $37,574 in debt (the national average for recent graduates) at 6.54% over a standard 10-year plan will pay approximately $13,700 in total interest.
For income-driven repayment plans, where monthly payments may not cover accruing interest, negative amortization can occur, the balance grows even as payments are made. This is compound interest working in the most unfavorable possible direction for the borrower.
Compounding and Inflation
Real vs. Nominal Returns
Inflation is a form of reverse compounding applied to purchasing power. If inflation runs at 3% annually, purchasing power roughly halves every 24 years (Rule of 72 again). This means investments must outpace inflation to produce real wealth growth.
A savings account earning 1% in a 3% inflation environment produces a negative real return of -2%. The balance grows nominally but shrinks in purchasing power. This is why holding large cash reserves for the long term carries its own risk, the invisible compounding of inflation steadily erodes real value.
For long-term wealth building, the relevant figure is the real rate of return: nominal return minus inflation. The S&P 500's historical real return of approximately 7% is what matters for retirement planning, not the nominal 10%.
Historical Inflation and Investment Returns
The relationship between inflation and investment returns has varied considerably across historical periods.
Bernstein (2002) in The Four Pillars of Investing documents that the 1970s, when US inflation averaged over 7%, devastated bond investors, whose nominal returns were mostly consumed by inflation, while stock investors barely kept pace.
The 1980s and 1990s, with declining inflation and rising corporate earnings, produced some of the strongest real equity returns in US history.
Malkiel (1973) in A Random Walk Down Wall Street notes that the appropriate benchmark is always the real return, the extent to which wealth outpaces the rising cost of living.
An investor who earned 5% annually in nominal terms while inflation averaged 5% generated exactly zero real wealth over decades, regardless of how impressive the nominal account balance looks.
The TIPS Solution
Treasury Inflation-Protected Securities (TIPS) are US government bonds specifically designed to compound in real, inflation-adjusted terms. The principal of a TIPS bond adjusts with the Consumer Price Index, so the coupon payment (calculated as a percentage of principal) also adjusts.
TIPS guarantee a real return rather than a nominal one. While their real yields have historically been lower than equity real returns, they provide certainty, compounding in real purchasing-power terms, that equities cannot.
Tax-Advantaged Accounts and the Compounding Advantage
Why Tax Deferral Multiplies Compounding
One of the most powerful but least-understood enhancements to compounding is tax deferral. In a taxable investment account, dividends and realized capital gains are taxed each year, reducing the base available to compound.
In a tax-deferred account (traditional IRA, 401(k)), no taxes are paid until withdrawal; the entire pre-tax amount compounds year after year.
The difference is substantial. Consider $10,000 invested at 7% over 30 years. In a taxable account with a 25% tax rate on annual returns, the effective after-tax return is approximately 5.25%. The result: approximately $46,900. In a tax-deferred account at 7%, the same investment grows to $76,123 before withdrawal taxes.
Even after paying 25% in taxes at withdrawal, the net result is approximately $57,092, about 22% more, purely from the compounding of tax deferral.
Bogle (2007) estimated that over a 30-year investment horizon, the tax drag on actively managed funds in taxable accounts can consume 2-3 percentage points of annual return, and the compounding effect of this drag represents a very large share of the performance gap between index funds and active management.
The Roth vs. Traditional Decision
The choice between a Roth account (after-tax contributions, tax-free growth and withdrawals) and a traditional account (pre-tax contributions, taxable withdrawals) depends on whether your tax rate is higher now or in retirement.
For young workers in low tax brackets, the Roth advantage is often decisive: by paying taxes now at a low rate and allowing decades of tax-free compounding, the effective value of the tax-free growth is enormous.
A $5,500 Roth contribution at age 22, growing at 7% to age 65, produces $90,000+ in completely tax-free funds.
The same contribution in a traditional account grows to the same nominal amount but is subject to tax at withdrawal, which, if retirement savings are substantial, may be at a higher effective rate.
Practical Takeaways
Start investing as early as possible. The mathematics of compounding makes early years far more valuable than later years, regardless of amounts. A single year of delay in your mid-twenties has a larger lifetime cost than might intuitively seem possible.
Automate contributions. The most reliable way to invest consistently is to remove the decision from the equation. Automatic monthly transfers into index funds eliminate behavioral drag.
Research by Thaler and Benartzi (2004) confirmed that automation dramatically increases participation rates and long-run savings outcomes, precisely because it bypasses the present-bias that delays manual contributions.
Eliminate high-interest debt first. No investment returns guaranteed 20%+ annually. Paying off high-interest credit cards is the highest risk-adjusted return available.
Reinvest dividends. Allowing dividends to compound rather than withdrawing them significantly increases long-term returns. Reinvested dividends have historically accounted for over 40% of total equity returns (Siegel, 2014).
Check compounding frequency on debt. When evaluating a loan or credit card, compare APY (which reflects compounding) rather than APR (which does not), to make accurate cost comparisons.
Use tax-advantaged accounts maximally. The compounding of tax deferral produces substantial additional wealth over long time horizons. Max out employer-matched 401(k) contributions first; then Roth or traditional IRA; then taxable accounts.
Understand the real rate of return. Inflation-adjusted returns are what matter for long-term wealth building. An investment that beats inflation by 5-7% annually over 30 years transforms modest regular contributions into substantial wealth.
Beware the minimum payment trap. Making minimum credit card payments is a compound-interest disaster for the borrower. Even modest additional payments above the minimum dramatically reduce total interest paid and time to payoff.
Sources & Further Reading
- Einstein, A. (attributed, date disputed). Quoted in various financial literature; origin unverified.
- Bogle, J. C. (2007). The Little Book of Common Sense Investing. Wiley.
- Bernstein, W. J. (2002). The Four Pillars of Investing. McGraw-Hill.
- Malkiel, B. G. (1973). A Random Walk Down Wall Street. W. W. Norton.
- Siegel, J. J. (2014). Stocks for the Long Run (5th ed.). McGraw-Hill.
- Consumer Financial Protection Bureau. (2023). Understanding Credit Card Interest. CFPB.
- US Department of Education. (2023). Understanding Student Loan Interest. Federal Student Aid.
- Vanguard Research. (2012). Dollar-Cost Averaging Just Means Taking Risk Later. Vanguard Group.
- Vanguard Research. (2022). The Long-Term Case for Equities. Vanguard Group.
- Federal Reserve Bank of St. Louis. (2024). S&P 500 Historical Returns. FRED Economic Data.
- Ibbotson, R. G., & Sinquefield, R. A. (1976). Stocks, Bonds, Bills, and Inflation: Year-by-Year Historical Returns. Journal of Business, 49(1), 11-47.
- Thaler, R. H., & Benartzi, S. (2004). Save More Tomorrow: Using Behavioral Economics to Increase Employee Saving. Journal of Political Economy, 112(S1).
- Laibson, D. (1997). Golden Eggs and Hyperbolic Discounting. Quarterly Journal of Economics, 112(2), 443-477.
- Ramsey, D. (2013). The Total Money Makeover. Thomas Nelson.
- Federal Reserve. (2024). Consumer Credit: Outstanding Revolving Credit. Federal Reserve Statistical Release G.19.
Frequently Asked Questions
What is compound interest and how does it work?
Compound interest calculates interest on both the original principal and all accumulated interest, so the balance earning interest grows every period. At 7% for 30 years, \(10,000 becomes \)76,123; under simple interest it would be only \(31,000. That \)45,000 difference is compounding.
What is the Rule of 72?
Divide 72 by the annual interest rate to estimate doubling time: at 6% your money doubles in ~12 years, at 8% in ~9 years. Works for debt too: a credit card at 24% APR doubles the balance in ~3 years without payments.
Why does starting early matter so much with compound interest?
Because compounding is exponential. An investor who puts in \(5,000/year from age 22-32 (10 years, \)50,000) then stops often ends up with more at 62 than one who invests \(5,000/year from 32-62 (30 years, \)150,000), at 8% returns. The early decade of compounding cannot be made up.
How does compound interest work on debt?
Exactly like on investments, but against you. A \(5,000 credit card balance at 20% APR with no payments reaches ~\)36,600 after 10 years. Paying off high-interest debt is mathematically equivalent to a guaranteed return at that rate, no investment reliably beats it.
What is the compound interest formula?
A = P(1 + r/n)^(nt): A is final amount, P is principal, r is annual rate as decimal, n is compounding periods per year, t is years. \(5,000 at 7% compounded monthly for 25 years = \)29,022.