The United States has the lowest intergenerational income mobility of any rich democracy. A child born in the bottom fifth of the income distribution in the US has roughly an 8% chance of reaching the top fifth as an adult. In Denmark, the same child has a 12% chance.
In Canada, 13%. In Australia, 14%. In the country that calls itself the "land of opportunity", in which the most famous cultural mythology is the self-made person rising from poverty to prosperity through talent and hard work, the statistical chances of achieving the American Dream are lower than almost anywhere else in the developed world.
This is not a contested finding. It emerges from rigorous administrative data covering millions of people, using consistent methodology applied across countries, replicated by multiple independent research teams. The result is robust.
The United States is, by the best available measures, one of the most economically rigid societies in the developed world: where you start in the income distribution has more influence on where you end up here than in Canada, Australia, Germany, France, or Scandinavia.
The mythology of meritocracy, the belief that talent and effort determine outcomes, is more culturally powerful in America than anywhere else, and more empirically false.
Understanding why requires understanding how mobility is measured, what the evidence shows about where in the United States mobility is high and low, what mechanisms create and sustain immobility, and what interventions the evidence suggests actually work.
The research on this question has accelerated dramatically in the past fifteen years, driven largely by the work of Raj Chetty and his collaborators, who have used administrative tax data at scales previously impossible and produced findings that have transformed how economists and policymakers think about opportunity in America.
"Where you grow up matters enormously. A child's chance of escaping poverty is strongly influenced by the county they happen to be born in.", Raj Chetty, Opportunity Atlas (2018)
Key Definitions
Intergenerational income mobility: The degree to which children's economic outcomes (income, wealth, education) are independent of their parents' economic outcomes. High mobility means a weak relationship; low mobility means a strong one.
Intergenerational earnings elasticity (IGE): The statistical measure of how much of the advantage or disadvantage of a parent's income position is transmitted to children. An IGE of 0 indicates perfect mobility; an IGE of 1 indicates that the entire income advantage is inherited.
Great Gatsby Curve: The empirical relationship, documented by economist Miles Corak, between income inequality (measured by the Gini coefficient) and intergenerational income immobility across countries. More unequal countries tend to have lower mobility.
Relative vs absolute mobility: Relative mobility refers to movement across the income distribution (does a bottom-quintile child reach the top quintile?). Absolute mobility refers to whether children earn more in real terms than their parents, regardless of their relative position.
Opportunity hoarding (Reeves): Richard Reeves's term for the practice by upper-middle-class families of using their resources and social capital to monopolize educational, professional, and housing advantages that preserve their children's economic position.
Opportunity Atlas: Raj Chetty's online tool providing mobility estimates for virtually every commuting zone and census tract in the United States, based on data from approximately 20.5 million Americans.
Social capital and mobility: The role of networks, trust, civic participation, and community relationships in enabling access to opportunities. High-social-capital communities tend to have higher mobility.
Neighborhood effects: The influence of the neighborhood a child grows up in, its schools, peer networks, physical safety, economic integration, and social norms, on their adult outcomes, independent of family characteristics.
Meritocracy myth: The critique, supported by mobility data, that highly unequal societies claiming to be meritocratic are in practice less meritocratic than more equal ones, because resource gaps translate into opportunity gaps.
Intergenerational Income Mobility: Cross-Country Comparison
| Country | Intergenerational earnings elasticity (IGE) | Probability of bottom quintile reaching top quintile | Income Gini coefficient | Key policy context |
|---|---|---|---|---|
| Denmark | ~0.15 | ~12% | ~0.28 | Universal childcare; free higher education; strong labor market institutions; compressed wages |
| Norway | ~0.17 | ~12% | ~0.26 | Similar Nordic model; oil revenues fund generous social investment |
| Finland | ~0.18 | ~11% | ~0.27 | High-quality universal education including early childhood; low inequality |
| Canada | ~0.19 | ~13% | ~0.33 | Universal healthcare removes medical poverty trap; strong public education |
| Germany | ~0.32 | ~9% | ~0.31 | Strong vocational education system; apprenticeships; but higher class sorting in secondary school |
| United Kingdom | ~0.50 | ~9% | ~0.35 | High inequality; elite school advantage strong; council housing privatization reduced social mixing |
| United States | ~0.45–0.50 | ~8% | ~0.39 | Highest inequality among rich democracies; health insurance tied to employment; local school funding by property tax |
| Italy | ~0.50 | ~7% | ~0.36 | Familialism; low female labor force participation; regional north-south divide |
| Brazil | ~0.58 | ~3% | ~0.53 | Very high inequality; legacy of slavery and land concentration; Bolsa Família reduced extreme poverty mobility somewhat |
Sources: Corak (2013), Chetty et al. (2014), OECD mobility data; figures are approximate
Measuring Mobility
Intergenerational Earnings Elasticity
The standard measure of intergenerational income mobility is the intergenerational earnings elasticity (IGE). If a family earns 50% more than the average family, and their children earn 25% more than average, the IGE is 0.50, half the advantage is transmitted to the next generation. The higher the IGE, the less mobile the society.
The United States has an IGE of approximately 0.45-0.50, consistently estimated across multiple studies using different data sources and time periods. Compare this to Denmark (approximately 0.15), Norway (0.17), Canada (0.19), Finland (0.18), and Germany (0.32).
The US and UK (approximately 0.50) cluster together at the low-mobility end of rich democracies, while the Nordic countries cluster at the high-mobility end.
Miles Corak, the economist who has compiled the most systematic cross-country comparisons of mobility, published the canonical summary in the Journal of Economic Perspectives in 2013 (doi: 10.1257/jep.27.3.79).
His analysis covers OECD countries with sufficient data quality and shows a remarkably consistent pattern: countries with low income inequality have high intergenerational mobility, and countries with high inequality have low mobility.
Rank-Rank Correlations
An alternative and increasingly preferred measure is the rank-rank correlation, developed by Raj Chetty and Nathaniel Hendren: rather than comparing absolute income levels, this measures the correlation between parents' position in the income distribution and children's eventual position.
A child whose parents are at the 25th income percentile would end up at the 25th percentile if mobility were zero, at the 50th percentile if mobility were perfect. In the US, Chetty's estimates suggest that such a child reaches approximately the 35th-37th percentile on average.
Absolute vs Relative Mobility
Absolute mobility, whether children earn more in real terms than their parents, has declined dramatically in the US. Chetty's 2017 paper in Science (with David Grusky, Maximilian Hell, Nathaniel Hendren, and Robert Manduca) tracked absolute mobility across birth cohorts by linking Census and tax data.
For children born in 1940, approximately 90% earned more than their parents in inflation-adjusted terms. For children born in 1980, that fraction had fallen to approximately 50%.
The decline was driven primarily not by slower economic growth overall but by the increasingly unequal distribution of gains: as income inequality widened, the gains of growth were increasingly concentrated at the top, leaving less improvement for children in the bottom half of the distribution.
The Great Gatsby Curve
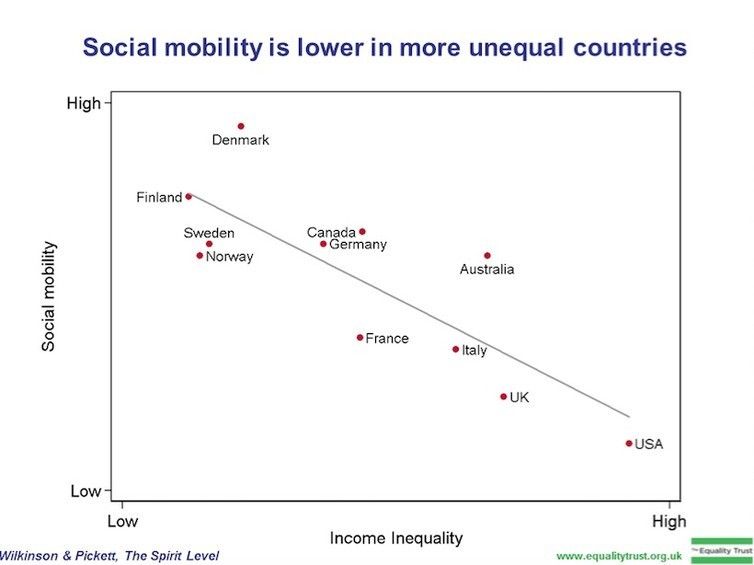
In January 2012, Alan Krueger, then chair of President Obama's Council of Economic Advisers, gave a speech displaying a graph that he called the Great Gatsby Curve. The graph plotted income inequality (Gini coefficient) against intergenerational earnings elasticity (IGE) for a range of developed countries.
The pattern was striking: countries with high income inequality, the US, UK, Italy, had high IGEs (low mobility). Countries with low inequality, the Nordic countries, Canada, Australia, had low IGEs (high mobility).
The term referenced F. Scott Fitzgerald's novel because its protagonist Jay Gatsby represented the quintessential American mythology of self-made success, the working-class boy who becomes fabulously wealthy through talent and determination.
The irony the curve illustrated was that this mythology is most culturally pervasive in precisely the societies where it is statistically least likely to be true.
Miles Corak's theoretical account of why the relationship exists, developed in detail in his 2013 Journal of Economic Perspectives paper, identifies three mechanisms.
First, larger gaps in family income translate directly into larger gaps in resources invested in children: nutrition, healthcare, housing stability, tutors, extracurricular activities, neighborhood quality.
A family at the 90th income percentile can invest far more in a child's development than a family at the 10th percentile, and that investment advantage compounds over eighteen years of childhood.
Second, in more unequal societies, high-income families have both greater incentives and greater resources to buy advantage for their children, through exclusive schools, unpaid internships accessible only to those who can afford to work for free, and social networks that provide access to opportunity.
Third, highly unequal societies give the wealthy greater political influence to shape the rules, tax policy, housing policy, education funding, in ways that preserve inter-generational advantage.
The Great Gatsby Curve does not prove causation, it is a cross-sectional correlation across countries, and unmeasured differences between countries could drive both inequality and immobility. But the mechanisms are plausible, have independent empirical support, and make the relationship theoretically coherent.
Chetty's Research
The Opportunity Atlas
Raj Chetty's research group has produced the most detailed empirical picture of mobility in the United States yet assembled, using administrative tax and Census data covering tens of millions of Americans.
The Opportunity Atlas, published as NBER Working Paper 25147 and made available as an interactive online tool, provides mobility estimates for virtually every commuting zone and census tract in the country based on data from approximately 20.5 million Americans born between 1978 and 1983.
The central finding of the Opportunity Atlas is dramatic geographic variation in mobility within the United States, variation that is hidden by national averages.
A child born to low-income parents in Salt Lake City, Minneapolis, or San Jose has substantially higher upward mobility than a child with identical family income born in Atlanta, Charlotte, or much of the South.
The differences are large: Chetty estimates that moving a low-income child from a low-mobility area to a high-mobility area at birth would increase their expected lifetime earnings by approximately 10-13%, comparable to the effect of some very intensive educational interventions.
What Predicts Mobility at the Local Level
The Opportunity Atlas identified several community-level characteristics correlated with high mobility. Economic integration, the degree to which low-income and high-income families live in proximity and share schools and public spaces, is consistently associated with higher mobility.
School quality, measured by test score improvement and not just average scores, matters. Social capital, measured through proxies like voter turnout and civic organization membership, matters. Community stability, measured by family structure and residential permanence, matters.
One of the most striking findings was the correlation between the fraction of two-parent families in a community and mobility outcomes, not just for children in two-parent families, but for all children in the community, including those in single-parent families.
This suggests that what matters is community-level social norms and networks, not just individual family structure. High-mobility communities provide social infrastructure, mentors, networks, institutional trust, that partly substitutes for advantages of family resources.
Mechanisms of Immobility
Educational Inequality
The Coleman Report of 1966, the largest social science study ever conducted at the time, found that variation in school quality explained remarkably little of the variation in student outcomes, that family background was a far stronger predictor of educational attainment than which school a child attended.
This finding, replicated in modified form many times since, has been interpreted both as evidence that schools cannot overcome family disadvantage and as evidence that equalizing schools without equalizing family resources is insufficient.
Subsequent research has refined Coleman's conclusion. School quality does matter, particularly teacher quality, which shows large effects in well-identified studies.
But the inputs families provide (vocabulary, health, stability, summer enrichment, extracurricular activities) are substantial and accumulate over years before school entry and throughout childhood.
By the time children enter kindergarten, there is already a vocabulary gap of approximately 30 million words between children raised in professional and in welfare-dependent families, estimated by Hart and Risley's 1995 research.
Opportunity Hoarding
Richard Reeves, a British-American scholar at the Brookings Institution, argues in Dream Hoarders (2017) that discussions of inequality and mobility focus excessively on the top 1% when the primary mechanism of immobility is the practices of the top 20%, households earning above approximately $120,000.
He identifies several specific mechanisms.
Exclusionary zoning in affluent suburbs, restrictions on multi-family housing that keep housing costs high, concentrates high-quality public schools in areas accessible only to the affluent.
The connection between residential address and school quality in the US is direct: public school funding tied to local property taxes means that high-property-value areas have high school funding.
This is not an accident but a policy choice that channels high-quality public services to those who need them least.
Legacy admissions at selective universities benefit the children of alumni, who are disproportionately affluent. Estimates suggest legacy status provides a boost roughly equivalent to 160 SAT points, effectively functioning as a heritable privilege in educational gatekeeping.
Unpaid internships in prestigious fields, policy, media, finance, law, fashion, are accessible primarily to those whose families can subsidize them. These internships have become a de facto credential for entry into competitive fields, and restricting access to them effectively restricts access to those fields to the already-affluent.
Neighborhood Effects
The Moving to Opportunity Experiment
Moving to Opportunity (MTO) was a randomized controlled experiment operated by the US Department of Housing and Urban Development in the 1990s across five cities: Baltimore, Boston, Chicago, Los Angeles, and New York.
Families living in high-poverty public housing were randomly assigned to receive a housing voucher restricted to low-poverty neighborhoods, a standard housing voucher usable anywhere, or no voucher. Approximately 4,600 families participated.
Early results, reported by Lawrence Katz, Jeffrey Kling, and Jeffrey Liebman, were mixed.
Families who moved to low-poverty neighborhoods showed significant improvements in mental health, particularly reduced rates of anxiety and depression in adults, and physical health (lower rates of obesity and diabetes).
But initial analyses showed no significant long-run economic benefits for children.
The picture changed dramatically in 2016 when Raj Chetty, Nathaniel Hendren, and Lawrence Katz reanalyzed the data using administrative tax records that allowed longer follow-up into adulthood.
Published in the Quarterly Journal of Economics (doi: 10.1093/qje/qjw033), their analysis found that children who were younger than 13 when their families moved to lower-poverty neighborhoods had incomes approximately 31% higher in their mid-20s compared to control-group children, higher college attendance rates, and lower rates of single parenthood.
For children who moved as teenagers, benefits were much smaller or absent. The finding suggested a critical period: neighborhood quality matters most during early and middle childhood, when social networks, educational environments, and developmental influences are most formative.
Education and Mobility
Returns to Education
The education-mobility relationship is complex. Higher educational attainment is strongly associated with higher earnings and upward mobility at the individual level. The college wage premium, the earnings advantage of a college degree over a high school diploma, has grown substantially since the 1980s.
But the rising cost of higher education and the explosion of student debt have created a system in which the investment required to access the credential that confers mobility has become itself a source of financial precariousness.
Raj Chetty's 2017 study of economic diversity and mobility at US colleges, published as an NBER working paper, found enormous variation in the degree to which colleges serve as mobility engines.
Community colleges including CUNY and Glendale Community College in California ranked among the top institutions for taking students from the bottom income quintile to the top quintile, not because their graduation rates or selectivity were high but because they drew from low-income populations and provided pathways to credentials that improved earnings.
Elite universities, by contrast, drew overwhelmingly from the top income quintiles and did little to change the relative income position of their graduates, who were already affluent.
Early Childhood Interventions
The strongest evidence for effective interventions to improve mobility comes from early childhood.
James Heckman's decades of research on the Perry Preschool Project, a randomized trial enrolling low-income African-American children in Michigan beginning in 1962, demonstrated persistent effects through age 40: higher rates of high school graduation, employment, and earnings; lower rates of arrest and incarceration.
Heckman's analysis of the cost-benefit calculation, published in Science in 2006 (doi: 10.1126/science.1128898), estimated annual returns to investment in high-quality early childhood programs of 7-12%.
The Abecedarian Project, an even more intensive randomized intervention from birth to age 5, showed similar persistence, including lower rates of metabolic syndrome in participants' 30s.
Heckman's theoretical account for why early intervention is so productive draws on his "skill formation" framework: cognitive and non-cognitive skills developed in early childhood are foundations on which later skills are built.
Skills are complementary across time, early skill acquisition makes later acquisition easier. This means that investing in a five-year-old is more productive than investing the same resources in a twenty-five-year-old, because the five-year-old has more years of compounding ahead and a more plastic foundation to build on.
Race and Mobility
Persistent Racial Gaps
Chetty, Hendren, Jones, and Porter's 2019 paper "Race and Economic Opportunity in the United States" (published in the Quarterly Journal of Economics) used data on 20 million Americans to document that racial gaps in upward mobility are large and not fully explained by differences in family income.
A Black boy born to a family at the 25th income percentile ends up, on average, at the 35th percentile as an adult. A white boy born to the same family ends up at the 45th percentile.
The gap is substantially smaller for women: Black and white women with identical family incomes show similar mobility outcomes, leading the authors to characterize the disparity as largely a crisis of Black male opportunity specifically.
Discrimination in labor markets is a well-documented mechanism. Marianne Bertrand and Sendhil Mullainathan's landmark 2004 American Economic Review audit study (doi: 10.1257/0002828042002561) sent identical resumes with either stereotypically white-sounding or Black-sounding names to actual job postings in Boston and Chicago.
Resumes with white-sounding names received 50% more callbacks for interviews. The resumes were identical in content; the only manipulation was the name at the top. Subsequent audit studies have replicated this finding across multiple occupations and cities.
Historical Policy and the Wealth Gap
The current racial wealth gap, the median white family holding approximately 7-8 times the net worth of the median Black family, is not simply the residue of slavery but also the consequence of specific 20th-century policies.
Richard Rothstein's 2017 book The Color of Law documents how federal, state, and local governments deliberately segregated American cities through explicit policy: racially restrictive covenants enforced by courts, Federal Housing Administration refusal to insure mortgages in Black neighborhoods (redlining), urban renewal programs that destroyed Black neighborhoods, and the exclusion of Black veterans from GI Bill benefits in the South.
The practical consequence was that the greatest wealth-building program in American history, the postwar expansion of homeownership subsidized by FHA mortgages and the GI Bill, was largely unavailable to Black Americans, while the neighborhoods they were confined to were systematically devalued by the same policies.
The long-run wealth consequences of this exclusion compound over generations and remain central to understanding contemporary racial gaps in income, wealth, and mobility.
Sources & Further Reading
- Chetty, R., Hendren, N., Kline, P., & Saez, E. (2014). Where is the Land of Opportunity? The Geography of Intergenerational Mobility in the United States. Quarterly Journal of Economics, 129(4), 1553-1623. doi:10.1093/qje/qju022
- Chetty, R., Hendren, N., & Katz, L.F. (2016). The Effects of Exposure to Better Neighborhoods on Children: New Evidence from the Moving to Opportunity Experiment. Quarterly Journal of Economics, 131(3), 855-902. doi:10.1093/qje/qjw033
- Corak, M. (2013). Income Inequality, Equality of Opportunity, and Intergenerational Mobility. Journal of Economic Perspectives, 27(3), 79-102. doi:10.1257/jep.27.3.79
- Reeves, R.V. (2017). Dream Hoarders: How the American Upper Middle Class Is Leaving Everyone Else in the Dust. Brookings Institution Press.
- Bertrand, M., & Mullainathan, S. (2004). Are Emily and Greg More Employable Than Lakisha and Jamal? A Field Experiment on Labor Market Discrimination. American Economic Review, 94(4), 991-1013. doi:10.1257/0002828042002561
- Heckman, J.J. (2006). Skill Formation and the Economics of Investing in Disadvantaged Children. Science, 312(5782), 1900-1902. doi:10.1126/science.1128898
- Chetty, R., Hendren, N., Jones, M.R., & Porter, S.R. (2019). Race and Economic Opportunity in the United States: An Intergenerational Perspective. Quarterly Journal of Economics, 135(2), 711-783.
- Rothstein, R. (2017). The Color of Law: A Forgotten History of How Our Government Segregated America. Liveright Publishing.
See also: How inequality affects health, How the economy grows, What is race
Frequently Asked Questions
How is social mobility actually measured and what do the numbers show?
Social mobility is most rigorously measured using the intergenerational earnings elasticity (IGE), which captures how much of a parent’s income position is inherited by their children. An IGE of 0 means children’s incomes are entirely independent of parents’ incomes, perfect mobility. An IGE of 1 means children’s incomes are completely determined by parents’ incomes, no mobility at all. The United States has an IGE of approximately 0.45-0.50, meaning that roughly half the earnings advantage of being in a high-income family persists into the next generation. This is higher, meaning less mobile, than Canada (IGE approximately 0.19), Denmark (approximately 0.15), Norway (approximately 0.17), and Finland (approximately 0.18). It is comparable to the United Kingdom (approximately 0.50) and higher than Germany (approximately 0.32). Miles Corak, who has compiled the most comprehensive cross-country comparisons, consistently finds the United States and United Kingdom clustered at the low-mobility end among rich democracies. A complementary measure is rank-rank correlations, developed by Raj Chetty and colleagues: how correlated are children’s income ranks with their parents’ ranks? Using administrative tax data covering millions of Americans, Chetty found that a child born in the bottom income quintile in the US has approximately an 8% chance of reaching the top quintile. The distinction between absolute and relative mobility is also important: absolute mobility (whether children earn more in real terms than their parents) has declined significantly in the US from 90% of children born in 1940 earning more than their parents, to approximately 50% for children born in 1980, according to Chetty’s 2017 Science paper on declining absolute mobility.
What is the Great Gatsby Curve?
The Great Gatsby Curve is the empirical relationship, documented by economist Miles Corak and popularized by Alan Krueger (then chair of the Council of Economic Advisers) in a 2012 speech, between a country’s level of income inequality and its level of intergenerational income mobility. When you plot OECD countries with income inequality (measured by the Gini coefficient) on one axis and intergenerational earnings elasticity on the other, a strong positive relationship appears: more unequal countries have less intergenerational mobility. Countries like Denmark and Norway, with relatively compressed income distributions, also have high mobility. The United States and United Kingdom, with more unequal income distributions, have low mobility. The relationship is striking because it directly contradicts the political argument that income inequality incentivizes effort and produces more dynamic, opportunity-rich societies. The evidence suggests the opposite: higher inequality produces societies that are less meritocratic, not more. Corak’s theoretical explanation for the relationship, published in the Journal of Economic Perspectives in 2013, has several components. First, larger gaps in family income translate into larger gaps in investment in children’s education, health, housing, and enrichment activities. Second, in more unequal societies, the affluent have greater incentives to use their resources to buy advantage for their children, through exclusive schools, unpaid internships, and social networks, and greater resources to do so. Third, the politically powerful wealthy in highly unequal societies can shape tax and education policy in ways that preserve their children’s advantages. The Great Gatsby Curve does not prove causation from inequality to immobility, but the mechanism is plausible and has empirical support.
What has Raj Chetty's research revealed about where you grow up?
Raj Chetty, currently a professor at Harvard, has produced the most influential body of empirical work on social mobility of the past two decades, primarily using large administrative datasets linking children’s tax records to their parents’. His Opportunity Atlas project (with Nathaniel Hendren, Maggie Jones, and Sonya Porter), published as NBER Working Paper 25147 and covering approximately 20.5 million Americans, created mobility estimates for virtually every commuting zone and county in the United States. The central finding is dramatic geographic variation in mobility within the United States. Children born to low-income families in Salt Lake City, San Jose, and Minneapolis have substantially higher upward mobility than children with similar family incomes born in Atlanta, Charlotte, and much of the Deep South. The difference is not small: Chetty’s estimates suggest that moving a low-income child from a low-mobility area to a high-mobility area at birth would increase their expected lifetime income by approximately 10-13%. The correlates of high-mobility places include: lower residential segregation by income and race, lower income inequality, better primary school quality, higher social capital (as measured by civic participation and voter turnout), and higher rates of two-parent families. Importantly, these correlates were identified at the community level, not the individual level, the presence of two-parent families in the community was associated with higher mobility for all children, including those in single-parent families, suggesting that community-level social norms and networks matter beyond individual family circumstances. The research does not establish which factors are causally operative, but it provides the most detailed picture yet of where the American Dream is and is not accessible.
What is opportunity hoarding and how does the upper-middle class block mobility?
Richard Reeves, a Brookings Institution scholar, argues in his 2017 book ‘Dream Hoarders’ that the main barrier to social mobility in the United States is not the super-rich 1% but the upper-middle class (roughly the top 20% by income, households earning above approximately $120,000) engaging in what he calls ‘opportunity hoarding.’ Reeves identifies several specific mechanisms. Exclusionary zoning in affluent suburbs, restrictions on multi-family housing that keep housing costs high, concentrates high-quality public schools in areas accessible only to the affluent, while simultaneously preventing the spatial integration that research suggests is necessary for mobility. Legacy admissions at selective universities, which Reeves estimates provide a boost roughly equivalent to a 160-point SAT score advantage, preferentially benefit the children of alumni who are disproportionately affluent. Unpaid internships in prestigious fields, finance, policy, media, law, are accessible primarily to those who can afford to work for free, providing a credential and network that are increasingly necessary for entry into these fields. Professional licensing requirements, which have expanded dramatically over the past 50 years, raise entry barriers in many occupations. Zoning and housing restrictions are increasingly recognized by economists across the political spectrum as probably the single largest structural barrier to mobility: exclusionary zoning in productive cities like San Francisco and New York prevents workers from moving to high-opportunity areas, with estimates of the aggregate economic cost running into trillions of dollars in foregone output. Reeves’s contribution is to direct attention to the mechanisms through which upper-middle-class families, not just billionaires, perpetuate inequality.
What did the Moving to Opportunity experiment find?
Moving to Opportunity was a randomized controlled experiment run by the US Department of Housing and Urban Development in the 1990s, in which families living in high-poverty public housing in Baltimore, Boston, Chicago, Los Angeles, and New York were randomly assigned to one of three conditions: a voucher to move to a low-poverty neighborhood (experimental group), a standard housing voucher usable anywhere (Section 8 group), or no voucher (control group). The experiment, designed by Lawrence Katz, Jeffrey Kling, and Jeffrey Liebman, enrolled approximately 4,600 families. Early results were mixed and somewhat disappointing: families who moved to low-poverty neighborhoods showed improvements in mental health (particularly reduced anxiety and depression) and physical health (lower rates of diabetes and obesity), but initial analyses found no significant effects on children’s long-run economic outcomes. This changed dramatically when Raj Chetty, Nathaniel Hendren, and Lawrence Katz revisited the data in 2016, tracking outcomes into adulthood using administrative tax records. Published in the Quarterly Journal of Economics, their analysis found that children who were younger than 13 when their families moved to lower-poverty neighborhoods had significantly better adult outcomes: 31% higher income in their mid-20s compared to control-group children, higher rates of college attendance, and lower rates of single parenthood. For children who were teenagers when the move occurred, benefits were much smaller or absent. This finding has had substantial policy influence, supporting programs that help low-income families move to higher-opportunity neighborhoods before children reach adolescence, and raising the stakes of housing policy for child development outcomes.
How much does early childhood education affect mobility?
The evidence for early childhood intervention is among the strongest in the economics of inequality and mobility, largely owing to long-run follow-up studies of programs launched in the 1960s and 1970s. The Perry Preschool Project enrolled 123 African-American children in poverty in Ypsilanti, Michigan, in 1962, randomly assigning them to a high-quality preschool program or a control condition. James Heckman, who won the Nobel Prize in Economics in 2000, has conducted the most rigorous analysis of Perry’s long-run outcomes, finding that participants had higher rates of high school graduation, employment, and earnings, and lower rates of arrest and incarceration, with the benefits persisting to age 40 and beyond. His estimates place the annual return to investment in high-quality early childhood programs at 7-12%, substantially above typical returns on other educational investments. The Abecedarian Project, a more intensive randomized intervention that provided full-day educational childcare from birth to age 5, showed similar long-run benefits, including higher rates of college attendance and lower rates of metabolic syndrome in participants’ 30s. The political-economic explanation for why early intervention is so effective draws on Heckman’s theory of skill formation: cognitive and non-cognitive skills developed in early childhood are the foundation on which later skills are built, making early investment more productive than later remediation. The implication is that the most effective time to address intergenerational immobility is before school entry, not through college scholarship programs. Head Start, the US federal preschool program reaching approximately one million children annually, shows more modest and contested results, likely because program quality is more variable than in the randomized trials.
How does race affect social mobility in the United States?
Racial disparities in social mobility are large and persistent. Chetty and colleagues’ 2019 paper ‘Race and Economic Opportunity in the United States’ (published in the Quarterly Journal of Economics with Nathan Hendren, Maggie Jones, and Sonya Porter) found that Black men have dramatically lower upward mobility than white men even when born into families with the same income. A Black boy born to a family in the 25th income percentile ends up, on average, at the 35th percentile as an adult, while a white boy born at the same percentile ends up at the 45th. The gap closes much more for Black and white women, leading the authors to characterize the disparity as largely a crisis of Black male opportunity specifically. Discrimination in labor markets is a well-documented mechanism. Marianne Bertrand and Sendhil Mullainathan’s 2004 American Economic Review study sent identical resumes with either stereotypically white-sounding names (Emily, Greg) or Black-sounding names (Lakisha, Jamal) to actual job postings in Boston and Chicago. Resumes with white-sounding names received 50% more callbacks for interviews, despite being otherwise identical. The wealth gap is a further structural barrier: the median white family holds approximately 7-8 times the net worth of the median Black family, reflecting the cumulative effects of historical exclusion from wealth-building programs (the GI Bill, FHA-insured mortgages) and active destruction of Black wealth (redlining, documented by Richard Rothstein in ‘The Color of Law’). Rothstein shows that federal, state, and local government policy deliberately segregated American cities in the 20th century, a history with ongoing consequences for where Black families live, what schools their children attend, and what wealth they accumulate.