Here's a complete breakdown of feedback loops: the simple circular mechanism behind everything from thermostats and ecosystems to economies and viral trends. You'll learn the two basic types, how to tell them apart, and why they shape the behavior of nearly every complex system.
What Is a Feedback Loop?
A feedback loop is a circular causal mechanism in which a system's output is fed back as input, influencing the system's own future behavior. Feedback loops are the fundamental building blocks of complex systems in biology, economics, ecology, and technology.
They come in two primary forms: reinforcing loops, which amplify change in a consistent direction, and balancing loops, which counteract change and push systems toward equilibrium.
In 1961, meteorologist Edward Lorenz was running weather simulations on an early computer at MIT. To save time, he decided to restart a simulation midway through using data from a previous printout. He expected identical results, the same inputs should produce the same outputs.
Instead, the weather patterns diverged dramatically. What started as a tiny difference, the printout showed three decimal places (0.506) while the computer used six (0.506127), snowballed into completely different weather systems within weeks of simulated time.
This phenomenon became known as the "butterfly effect": a butterfly flapping its wings in Brazil could theoretically trigger a tornado in Texas. More precisely, Lorenz had discovered that weather systems contain powerful feedback loops where small changes amplify through the system, creating massive effects.
Lorenz's discovery wasn't limited to weather. Feedback loops, where outputs circle back to become inputs, are fundamental mechanisms shaping virtually every complex system: ecosystems, economies, organizations, technologies, human behavior, and social dynamics.
"You can't understand a system just by looking at it. You have to watch it change over time." - Donella Meadows
Understanding how feedback loops work reveals why:
- Rich tend to get richer (compound interest)
- Viral content explodes then disappears
- Organizations resist change despite obvious problems
- Technology adoption accelerates suddenly after years of slow growth
- Panic spreads faster than calm
- Ecosystems maintain equilibrium despite constant change
This article explains feedback loops comprehensively: what they are, how they work, the difference between reinforcing and balancing loops, why delays matter, how multiple loops interact, real-world examples across domains, how to identify and map feedback loops, their role in creating complex system behavior, and practical implications for intervening in systems.
Defining Feedback Loops
A feedback loop exists when the output of a system influences its own future behavior, creating a circular causal chain rather than linear cause-and-effect.
Basic Structure
Linear causality: A → B → C (one-directional)
Feedback loop: A → B → C → A (circular)
The output (C) feeds back to influence the input (A), creating a cycle that continues over time.
Simple Example: Room Temperature Control
Without feedback: Heater runs at constant rate regardless of temperature. Room gets too hot or too cold.
With feedback loop:
- Thermostat measures current temperature
- Compares to desired temperature (setpoint)
- Heater adjusts: If too cold, increase heat. If too warm, decrease heat.
- Temperature changes based on heater output
- Loop repeats: New temperature measurement feeds back into next adjustment
Result: Temperature stabilizes near setpoint through continuous self-correction.
Key Characteristics
Circularity: Cause becomes effect becomes cause
Time dependency: Behavior unfolds over multiple cycles
Self-influence: System affects its own future state
Non-linearity: Small inputs can produce large outputs (or vice versa) depending on loop structure
The Two Types: Reinforcing vs. Balancing
Feedback loops come in two fundamental varieties with opposite effects.
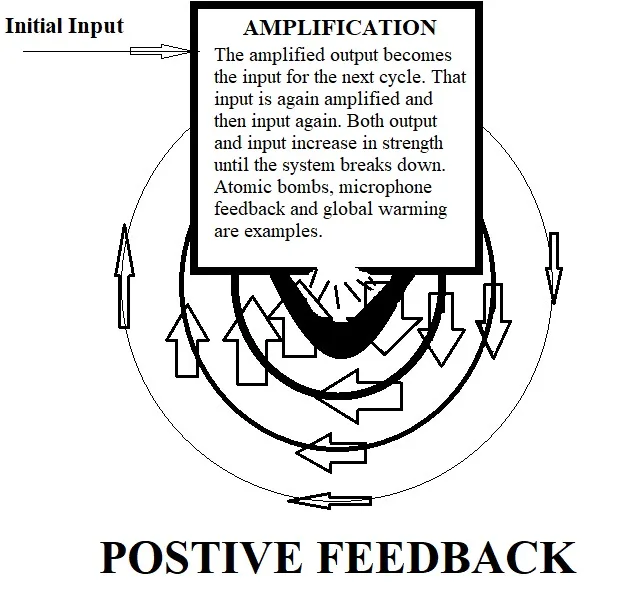
Reinforcing Feedback Loops (Positive Feedback)
Definition: Amplifying cycles where change produces more change in the same direction.
Structure: More A → More B → More A → More B...
Effect: Exponential growth or decline. Creates instability and acceleration.
Terminology note: "Positive feedback" doesn't mean "good", it means "self-amplifying." Can be growth (good) or panic (bad).
Core mechanism: Success breeds success. Failure breeds failure.
Classic Examples
Compound interest:
- More money → More interest → More money → More interest...
- Wealth accumulates exponentially
- More users → More value → More users attracted → More value...
- Platforms grow explosively (Facebook, WhatsApp)
Panic:
- Bad news → Fear → Selling → Prices fall → More fear → More selling...
- Markets crash rapidly
Skill development:
- Practice → Better performance → More confidence → More practice → Better performance...
- Experts pull ahead of beginners
Viral content:
- Shares → Visibility → More shares → More visibility...
- Content explodes in reach
Balancing Feedback Loops (Negative Feedback)
Definition: Self-correcting cycles where change produces countervailing change toward a goal or equilibrium.
Structure: More A → Less A (through B, C, D...)
Effect: Stability, oscillation around target, resistance to change.
Terminology note: "Negative feedback" doesn't mean "bad", it means "self-correcting."
Core mechanism: Deviation from goal triggers correction back toward goal.
Classic Examples
Thermostat (as described above):
- Temperature above setpoint → Heater off → Temperature falls → Heater on...
- Maintains equilibrium
Supply and demand:
- High prices → Less demand + More supply → Prices fall → More demand + Less supply → Prices rise...
- Markets find equilibrium price
Homeostasis (body temperature, blood sugar):
- Blood sugar rises → Insulin released → Blood sugar falls → Less insulin...
- Body maintains stable internal state
Organizational resistance:
- Change proposed → Threatens status quo → Resistance mobilizes → Change blocked...
- Organizations maintain current state
Predator-prey cycles:
- More rabbits → More foxes (food abundant) → Fewer rabbits (eaten) → Fewer foxes (food scarce) → More rabbits...
- Populations oscillate
Distinguishing the Types
| Characteristic | Reinforcing Loop | Balancing Loop |
|---|---|---|
| Direction | Amplifies change (same direction) | Dampens change (toward goal) |
| Behavior | Exponential growth/decline | Stability, oscillation |
| Stability | Unstable (accelerating) | Stable (equilibrating) |
| Goal | No inherent goal | Seeks target/equilibrium |
| Duration | Eventually hits limits | Can continue indefinitely |
| Example | Compound interest | Thermostat |
The Critical Role of Delays
Delays, time lags between action and consequence, fundamentally change feedback loop behavior.
"The greatest shortcoming of the human race is our inability to understand the exponential function." - Albert Allen Bartlett
Delays in Balancing Loops: Oscillation
Problem: When correction lags behind actual state, systems overshoot and oscillate.
Shower temperature example:
- Water too cold → Turn hot water up
- Delay: Water in pipes hasn't reached you yet
- Still cold → Turn up more
- Delay: Still hasn't reached you
- Turn up more
- Hot water arrives, too hot (you overcorrected)
- Turn cold water up
- Cycle repeats: Oscillating between too hot and too cold
Mechanism: Can't sense current effect of actions, so over-correct, creating oscillation.
Real-World Examples
Business inventory:
- Orders placed → 6-week delay → Inventory arrives
- During delay, sales data suggests shortage
- Order more
- All orders arrive → Massive surplus → Stop ordering → 6-week delay → Inventory depleted
- Oscillating boom-bust in inventory levels
Economic policy:
- Recession → Stimulus → 12-18 month delay → Economy recovers
- During delay, economy still looks bad → More stimulus
- Eventually: Overheating, inflation
- Tighten policy → Delay → Recession
- Boom-bust cycles partly due to policy delays
Organizational change:
- Problem identified → Solution implemented → Months delay → Effects visible
- During delay: "It's not working!" → More extreme measures
- Original solution kicks in + extreme measures → Overshoot
- Correction → Oscillation between extremes
Delays in Reinforcing Loops: Slow Then Fast Growth
Effect: Long periods of slow growth followed by explosive acceleration (S-curve).
Technology adoption example:
- New technology → Few early adopters
- Network effects weak (few users)
- Slow growth period (years)
- Reach critical mass
- Network effects strengthen
- Growth accelerates (months)
- Rapid adoption until saturation
Examples: Telephones, internet, smartphones, social networks all showed this pattern.
Mechanism: Reinforcing loop present but weak initially. Delay before accumulation reaches threshold triggering explosive phase.
Managing Delays
Anticipate lag: Act on predicted future state, not just current state
Reduce delays: Faster feedback enables better control (real-time data vs. quarterly reports)
Damp responses: Smaller corrections reduce oscillation
Monitor leading indicators: Predict future state earlier
Multiple Interacting Feedback Loops
Real systems contain many feedback loops operating simultaneously. Understanding which dominates when is crucial.
Reinforcing + Balancing: S-Curve Growth
Phase 1: Slow growth (balancing loop dominates)
- Initial conditions unfavorable
- Resistance high
- Reinforcing loop weak
Phase 2: Exponential growth (reinforcing loop dominates)
- Critical mass reached
- Resistance overcome
- Positive feedback accelerates growth
Phase 3: Plateau (balancing loop dominates again)
- Limits reached (market saturation, resource constraints)
- Negative feedback slows growth
- System stabilizes
Examples: Technology adoption, population growth (logistic curve), epidemic spread, market penetration.
Competing Reinforcing Loops
Virtuous cycles vs. vicious cycles: Which loop gets triggered early determines long-term trajectory.
Startup example:
Virtuous cycle:
- Good product → Happy customers → Referrals → More customers → More revenue → Better product → More happy customers...
Vicious cycle:
- Bugs → Unhappy customers → Bad reviews → Fewer customers → Less revenue → Can't fix bugs → More unhappy customers...
Critical point: Early stages determine which loop dominates. Small initial differences produce massive long-term divergence.
Shifting Loop Dominance
Systems can transition between loop types as contexts change.
Weight loss example:
Initial phase (balancing loop):
- Diet and exercise → Weight loss → Hunger increases, energy decreases → Harder to maintain → Weight plateaus
- Body's homeostasis resists change
If persist (reinforcing loop):
- Weight loss → Easier movement, better health → More exercise → More weight loss...
- Virtuous cycle emerges
Key: Push through initial balancing loop resistance until reinforcing loop kicks in.
Feedback Loops Across Domains
Recognizing feedback loop patterns across different contexts reveals universal dynamics.
Economics and Business
Rich get richer (reinforcing):
- Wealth → Investment returns → More wealth...
- Income inequality accelerates
Brand reputation (reinforcing):
- Quality → Good reputation → Premium prices + Talent attracted → Resources for quality...
Price wars (reinforcing decline):
- Price cut → Competitors cut → Market erodes → Less profit → Must cut more...
Regulation and compliance (balancing):
- Problem emerges → Regulation → Problem addressed → Less regulation...
- Oscillating regulatory cycles
Technology and Innovation
Platform network effects (reinforcing):
- Users → Developers → Apps → More users → More developers...
- Winner-take-all dynamics
Learning curve (reinforcing):
- Production volume → Efficiency gains → Lower costs → More customers → More volume...
- Cost falls 10-25% with each doubling of cumulative production
Technical debt (reinforcing decline):
- Quick hacks → More debt → Slower development → More pressure → More hacks...
- Code quality deteriorates
Bug fixing (balancing):
- Bugs found → Fixed → Fewer bugs → Less urgency → Bugs accumulate → More found...
- Oscillating bug counts
Social Dynamics
Polarization (reinforcing):
- Group identity → Selective exposure → Stronger beliefs → Stronger identity...
- Groups diverge into echo chambers
Social proof (reinforcing):
- People doing X → Perceived as normal → More people do X...
- Trends emerge and spread
Controversy (reinforcing):
- Attention → Outrage → More attention...
- Scandals amplify
Norm enforcement (balancing):
- Deviance → Social sanction → Conformity...
- Groups maintain stability
Organizational Behavior
Success trap (reinforcing):
- Success → Confidence → Less innovation → Vulnerability → Eventual failure
- Kodak, Blockbuster, Nokia
Bureaucracy (reinforcing):
- Rules → Problems slip through → More rules → More complexity → More problems...
- Red tape accumulates
Blame culture (reinforcing decline):
- Mistake → Blame → Fear → Hiding problems → Bigger mistakes...
- Psychological safety erodes
Learning culture (reinforcing growth):
- Experiment → Learn → Better decisions → Success → Confidence to experiment...
- Continuous improvement
Personal Development
Confidence (reinforcing):
- Small wins → Confidence → Attempt harder challenges → Skills improve → More wins...
- Mastery accelerates
Depression (reinforcing decline):
- Low mood → Inactivity → Worse mood → Less energy → More inactivity...
- Mental health deteriorates
Habit formation (reinforcing):
- Behavior → Neural pathway strengthens → Easier next time → More behavior...
- Habits solidify
Stress (reinforcing):
- Stress → Poor sleep → Reduced capacity → More stress...
- Burnout spiral
Identifying and Mapping Feedback Loops
Practical techniques for recognizing and visualizing loops in systems you encounter.
Step 1: Identify System Elements
List key variables that change over time in your system.
Example (company growth):
- Customers
- Revenue
- Product quality
- Employee count
- Brand reputation
Step 2: Map Causal Relationships
For each element, ask: "What affects this? What does this affect?"
Create arrows showing influence direction.
Example:
- Revenue → Product quality (more money = better development)
- Product quality → Customers (better product = more customers)
- Customers → Revenue (more customers = more revenue)
Step 3: Find Circular Chains
Trace paths back to starting point. Where does A eventually influence A again?
Example: Revenue → Product quality → Customers → Revenue
Found a loop!
Step 4: Label Loop Type
Reinforcing: Change amplifies in same direction
- More customers → More revenue → Better product → More customers (reinforcing growth)
Balancing: Change triggers opposite response
- High price → Low demand → Lower price → Higher demand (balancing toward equilibrium)
Step 5: Identify Delays
Where is there time lag between cause and effect?
Example: Product improvements take 6 months to reach customers (development lag)
Mark delays on loop diagram, they're crucial for behavior.
Causal Loop Diagram Notation
Standard conventions:
Arrow (+): Change in same direction
- More A → More B (or Less A → Less B)
Arrow (−): Change in opposite direction
- More A → Less B (or Less A → More B)
R or B label: Reinforcing or Balancing loop
Delay mark: Two short lines across arrow (||)
Example diagram notation:
    (+)      (+)      (+)
Revenue → Quality → Customers
    ↑                    |
    +--------------------+
           (+)
    [R - Reinforcing Loop]
Common Patterns to Recognize
"Success to the successful": Winner-take-all dynamics (reinforcing)
"Fixes that fail": Solution creates worse problem later (reinforcing)
"Tragedy of the commons": Individual benefit, collective harm (reinforcing)
"Shifting the burden": Symptomatic solution undermines fundamental solution (reinforcing)
"Limits to growth": Reinforcing growth meets balancing constraint (R + B)
How Feedback Loops Create Complex Behavior
Understanding loops reveals why systems behave non-intuitively.
Emergence
Definition: System behaviors that arise from interactions, not present in individual parts.
Mechanism: Multiple feedback loops interacting produce patterns no single loop would create.
Examples:
- Flocking in birds: Simple rules (stay close, match speed, avoid collision) + feedback → Complex coordinated patterns
- Market bubbles: Individual rational decisions + feedback → Collective irrationality
- Traffic jams: Mild slowdown + feedback → Stop-and-go waves
Implication: Can't understand system by analyzing parts separately. Must examine feedback structure.
Non-Linearity
Definition: Output not proportional to input. Small causes, large effects (or vice versa).
Mechanism: Reinforcing loops amplify small differences. Thresholds exist where behavior shifts.
Examples:
- Tipping points: Slow change until critical mass, then rapid transition (technology adoption, political movements)
- Black swan events: Rare but massive impact (financial crises, pandemics)
- Butterfly effect: Tiny initial differences → Vastly different outcomes
Implication: Linear extrapolation fails. System can shift suddenly and dramatically.
Path Dependence
Definition: History matters. Current state depends on past trajectory, not just current conditions.
Mechanism: Reinforcing loops lock in early advantages. Initial conditions determine which loop dominates.
Examples:
- QWERTY keyboard: Not optimal but locked in by network effects
- VHS vs. Betamax: Small early lead → Reinforcing loop → Winner takes all
- Career trajectories: Early success → Opportunities → More success. Early struggles → Fewer opportunities → More struggles.
Implication: Timing and initial conditions critically important. Past constrains future options.
Resilience and Fragility
Resilience: System resists disruption, returns to equilibrium (strong balancing loops)
Fragility: System vulnerable to cascading failure (reinforcing decline loops)
Examples:
- Resilient: Ecosystems with diverse species, redundant pathways
- Fragile: Monocultures, highly optimized systems with no slack, deeply interconnected systems where problems cascade
Implication: Efficiency (eliminating balancing loops) can create fragility. Redundancy and diversity create resilience.
Intervening in Feedback Loops
Practical strategies for changing system behavior by working with feedback structures.
Strategy 1: Slow or Break Reinforcing Loops
When: Vicious cycles, runaway growth, arms races
How: Interrupt causal chain, weaken links, introduce constraints
Examples:
- Panic spirals: Circuit breakers in stock markets halt trading, breaking feedback loop
- Arms races: Treaties limit escalation
- Polarization: Expose people to diverse views, weakening echo chamber loops
- Debt spirals: Bankruptcy breaks cycle allowing restart
Strategy 2: Strengthen or Trigger Balancing Loops
When: Want stability, need self-correction
How: Create feedback bringing system toward goals, introduce homeostatic mechanisms
Examples:
- Management dashboards: Real-time feedback enables corrective action
- Automated controls: Software tests catch bugs (balancing loop) before accumulation
- Incentive alignment: Tie compensation to outcomes, creating self-correcting behavior
- Transparency: Public scrutiny creates accountability loop
Strategy 3: Change Loop Goals
When: Balancing loop maintains wrong equilibrium
How: Shift targets, change what system tries to achieve
Examples:
- Metrics: Measure outcomes not activities (quality not quantity)
- Incentives: Reward innovation not just efficiency
- Culture: Shift norms about acceptable behavior
- Regulation: Change rules defining success
Strategy 4: Shorten Delays
When: Oscillation, overshoot, slow response
How: Faster feedback, real-time data, quicker action
Examples:
- Agile development: Rapid iterations vs. long waterfall cycles
- A/B testing: Immediate feedback on changes
- Financial dashboards: Real-time metrics vs. quarterly reports
- Direct communication: Remove intermediaries slowing feedback
Strategy 5: Find Leverage Points
Not all interventions are equally powerful. Meadows identified leverage points from weak to strong:
"We are not just living in a complex world; we are building it, and our decisions about what to build are inscribed in the feedback structures we create." - Jay Forrester
Low leverage:
- Numbers (budgets, subsidies)
- Buffers (inventory sizes, reserves)
- Stock and flow structures
Medium leverage:
- Delays (shorten response times)
- Balancing loops (strengthen self-correction)
- Reinforcing loops (break vicious cycles)
High leverage:
- Information flows (who knows what when)
- Rules (incentives, constraints, freedoms)
- System goals (what's valued and measured)
Highest leverage:
- Paradigms (mental models, assumptions)
- Ability to transcend paradigms (flexibility, learning)
Implication: Focus on high-leverage interventions (information, rules, goals) rather than low-leverage tweaks (budgets).
Strategy 6: Work With, Not Against, Feedback
Principle: Leverage existing loops rather than fighting them.
Examples:
- Viral marketing: Design products with built-in sharing loops
- Network effects: Subsidize early adoption to trigger reinforcing growth
- Habit formation: Structure environment to strengthen desired behavior loops
- Social proof: Highlight others' behavior to activate conformity loops
Cautions
Unintended consequences: Intervening in one loop affects others. Changes propagate in unexpected ways.
Delays in effects: Interventions take time. Patience required.
Resistance: Strong balancing loops maintain status quo. Change requires overcoming inertia.
Feedback dominance shifts: What works in one phase (e.g., growth) may not work in another (e.g., maturity).
Case Studies: Feedback Loops in Action
"The behavior of a system cannot be known just by knowing the elements of which the system is made." - Donella Meadows
Case 1: The 2008 Financial Crisis
System: Housing market, mortgage lending, financial securities
Reinforcing loop (boom):
- Rising home prices
- More people buy (expecting appreciation)
- Banks lend more (collateral value rising)
- More buyers → Prices rise faster
- Loop accelerates
Reinforcing loop (bust):
- Prices plateau
- Defaults increase (overleveraged buyers)
- Banks tighten lending
- Fewer buyers → Prices fall
- More defaults (underwater mortgages)
- Loop accelerates downward
Delays: Mortgages written years before consequences visible. Crisis appeared sudden but feedback loops building for years.
Lesson: Reinforcing loops eventually hit limits. Booms contain seeds of busts.
Case 2: Amazon's Virtuous Cycle
Jeff Bezos drew Amazon's strategy as feedback loop:
- Lower prices
- More customers
- More sellers on platform
- Greater selection
- Better customer experience
- More customers → Higher volume
- Lower costs (economies of scale)
- Lower prices [back to step 1]
Key insight: Each turn of loop strengthens next turn. Competitors face reinforcing disadvantage.
Result: Dominant market position built systematically through virtuous cycle.
Lesson: Design business model as reinforcing loop. Competitive moats emerge from feedback structure.
Case 3: Wikipedia's Surprising Stability
Expectation: Open editing would create chaos (reinforcing loop of vandalism)
Reality: Remarkably stable and accurate (balancing loops dominate)
Balancing loops:
- Vandalism occurs
- Community notices quickly (many watching)
- Reverts to previous version
- Vandal discouraged (futile effort)
- Less vandalism
Additional loops:
- More editors → Better quality → More readers → More editors
- More readers → More donations → Better infrastructure → More readers
Lesson: Well-designed balancing loops can maintain quality in open systems. Community feedback effects can dominate individual bad behavior.
Conclusion: Thinking in Loops
Linear thinking, A causes B, fails for most important problems. Feedback loops are the grammar of complex systems.
The key insights:
1. Feedback is everywhere, from thermostats to ecosystems to economies, circular causation is fundamental. Recognizing loops reveals why systems behave as they do.
2. Reinforcing loops accelerate, balancing loops stabilize, reinforcing loops create growth/decline, instability, and path dependence. Balancing loops create equilibrium, oscillation, and resistance to change. Most systems contain both.
3. Delays change everything, time lags between action and consequence create oscillation, overshoot, and non-obvious dynamics. Managing delays is crucial for control.
4. Multiple loops interact, which loop dominates when determines system behavior. Small initial differences can trigger different loops, producing vastly different outcomes (path dependence).
5. Loops create emergence, complex patterns arise from simple feedback structures. Flocking, markets, traffic, polarization, innovation, all emerge from underlying loops.
6. High-leverage interventions work with loops, effective change comes from altering feedback structures (information flows, rules, goals) rather than fighting symptoms. Find leverage points.
7. Maps are essential tools, causal loop diagrams make invisible feedback structures visible, enabling better understanding and intervention.
As Donella Meadows wrote: "The thinking world is wide and it is deep. There's always more to learn. But a good place to start is understanding the dance of feedback loops."
Edward Lorenz's butterfly effect wasn't chaos, it was feedback loops amplifying small differences. The weather isn't random; it's governed by circular causation too complex for simple prediction.
The same is true for organizations, economies, technologies, and societies. They're not chaotic, they're governed by feedback loops. Understanding those loops is the first step toward influencing complex systems rather than being buffeted by forces that seem mysterious but are, in fact, comprehensible.
When you see exponential growth, ask what reinforcing loop drives it and what balancing loop will eventually constrain it. When you see resistance to change, ask what balancing loop maintains the status quo. When you see oscillation, ask what delays create overshoot.
Think in loops. The world will make more sense, and your interventions will be more effective.
Sources & Further Reading
Forrester, J. W. (1961). Industrial dynamics. MIT Press.
Meadows, D. H. (2008). Thinking in systems: A primer. Chelsea Green Publishing.
Meadows, D. H. (1999). Leverage points: Places to intervene in a system. Whole Earth, Winter. View source
Senge, P. M. (1990). The fifth discipline: The art and practice of the learning organization. Doubleday.
Sterman, J. D. (2000). Business dynamics: Systems thinking and modeling for a complex world. McGraw-Hill.
Lorenz, E. N. (1963). Deterministic nonperiodic flow. Journal of the Atmospheric Sciences, 20(2), 130–141. DOI: 10.1175/1520-0469(1963)020<0130:DNF>2.0.CO;2
Arthur, W. B. (1989). Competing technologies, increasing returns, and lock-in by historical events. The Economic Journal, 99(394), 116–131. DOI: 10.2307/2234208
Wiener, N. (1948). Cybernetics: Or control and communication in the animal and the machine. MIT Press.
Kim, D. H. (1992). Guidelines for drawing causal loop diagrams. The Systems Thinker, 3(1), 5–6.
Sterman, J. D. (2001). System dynamics modeling: Tools for learning in a complex world. California Management Review, 43(4), 8–25. DOI: 10.2307/41166098
- Meadows, D. H. "Thinking in Systems: A Primer." Chelsea Green Publishing, 2008.
- Lorenz, E. N. "Deterministic Nonperiodic Flow." Journal of the Atmospheric Sciences, 1963.
- Senge, P. M. "The Fifth Discipline: The Art and Practice of the Learning Organization." Doubleday, 1990.
- Forrester, J. W. "Industrial Dynamics." MIT Press, 1961.
- Sterman, J. D. "Business Dynamics: Systems Thinking and Modeling for a Complex World." McGraw-Hill, 2000.
- Arthur, W. B. "Competing Technologies, Increasing Returns, and Lock-In by Historical Events." The Economic Journal, 1989.
- Wiener, N. "Cybernetics: Or Control and Communication in the Animal and the Machine." MIT Press, 1948.
- Kahneman, D., & Tversky, A. "Prospect Theory: An Analysis of Decision Under Risk." Econometrica, 1979.
- Meadows, D. H. "Leverage Points: Places to Intervene in a System." Whole Earth, 1999.
- Gleick, J. "Chaos: Making a New Science." Viking Penguin, 1987.
Researchers Who Formalized Feedback Loop Theory Across Disciplines
Feedback loop analysis developed simultaneously in multiple scientific disciplines during the twentieth century, with researchers building bridges across engineering, biology, economics, and organizational science to establish a unified understanding of circular causation.
Jay Forrester (1918-2016) was an electrical engineer at MIT who pioneered System Dynamics, the formal quantitative approach to modeling feedback structures in social and industrial systems.
Forrester's 1961 book Industrial Dynamics presented the first computer models of industrial supply chains, demonstrating mathematically how feedback delays produce the "bullwhip effect," the pattern in which small fluctuations in retail demand are amplified into large inventory swings at the manufacturing level.
His 1969 book Urban Dynamics applied the same modeling approach to cities, finding the counterintuitive result that low-income housing construction in declining cities could worsen poverty by preventing economic revitalization, a finding that generated enormous controversy but also influenced urban planning methodology.
Forrester's most significant contribution may have been training Donella Meadows, Dennis Meadows, and their colleagues who produced The Limits to Growth in 1972, a system dynamics model of global resource use and population growth whose core feedback dynamics have proven remarkably accurate in their broad trajectory despite continued controversy over their specific parameters.
A 2012 analysis by Australian researcher Graham Turner, published in GAIA, found that the standard run simulation's projections for global population, food production, and pollution matched observed data from 1970 to 2010 with a correlation exceeding 0.95.
Norbert Wiener (1894-1964) was a mathematician at MIT who coined the term "cybernetics" in his 1948 book Cybernetics: Or Control and Communication in the Animal and the Machine, establishing the formal study of feedback-controlled systems.
Wiener's central insight was that purposive behavior, whether in a machine or an organism, requires a feedback mechanism comparing actual behavior to a goal state and correcting deviations. This insight unified the study of animal nervous systems and engineered control systems under a single mathematical framework.
Wiener recognized immediately that his framework applied to social systems: his second major book, The Human Use of Human Beings (1950), explored the social implications of cybernetic systems, including the possibility of automated systems replacing human workers, the dangers of positive feedback in social amplification processes, and the importance of information quality for social control.
His warnings about feedback-driven social amplification, written in 1950, anticipate precisely the dynamics of social media virality and algorithmic polarization that became dominant social concerns seventy years later.
Donella Meadows (1941-2001) extended Forrester's system dynamics into accessible public communication and identified the practical leverage points for changing feedback structures.
Her 1999 essay "Leverage Points: Places to Intervene in a System," later expanded in Thinking in Systems (2008), ranks twelve types of systemic intervention from weakest (changing numerical parameters like tax rates) to strongest (changing the paradigms or goals that define what the system optimizes).
The ranking is counterintuitive in important ways: changing information flows (who knows what when) is rated more powerful than changing physical stocks and flows, and changing system goals is rated more powerful than changing the rules of the system.
Meadows illustrated these rankings with case studies from fishing regulation, climate policy, and economic management.
Her framework has been applied in climate negotiations by researchers at the Stockholm Resilience Centre, in organizational design by consultants at McKinsey and Deloitte, and in public health system design by researchers at the WHO, making it one of the most practically influential frameworks in systems thinking.
Documented Cases Where Feedback Loop Analysis Changed Real Outcomes
Feedback loop theory becomes actionable when applied to specific systems with measurable outcomes. Several well-documented cases demonstrate how identifying and deliberately modifying feedback structures produced significant real-world effects.
The Beer Distribution Game and Supply Chain Reform (1960s-2020s). John Sterman at MIT Sloan School of Management has administered the Beer Distribution Game, the supply chain simulation originally developed by Jay Forrester, to over 8,000 managers and executives across dozens of countries since the 1980s.
His 1989 paper "Modeling Managerial Behavior: Misperceptions of Feedback in a Dynamic Decision Making Experiment," published in Management Science, documented that virtually all players, including experienced supply chain managers, generated large oscillations in inventory because they systematically underestimated delivery delays and overreacted to shortages.
The key finding was that players could not distinguish between orders in the pipeline (already placed, not yet arrived) and actual inventory, causing them to double-order during shortages and then face massive surpluses when all orders arrived simultaneously.
This diagnosis directly influenced supply chain management practice: enterprise resource planning (ERP) systems implemented from the 1990s onward include pipeline visibility features specifically designed to break the information gap that drives bullwhip oscillation.
Research by Hau Lee at Stanford, published in 1997 in Harvard Business Review, documented that companies implementing pipeline visibility systems reduced inventory oscillation amplification by an average of 60% compared with industry benchmarks.
During the COVID-19 pandemic, companies with advanced ERP systems providing real-time pipeline visibility recovered from supply disruptions significantly faster than those relying on traditional ordering processes.
Australia's Carbon Price and Feedback Loop Design (2012-2014). Australia's Carbon Pricing Mechanism, implemented in 2012 and repealed in 2014, provides a rare opportunity to study how a feedback loop designed into economic policy performs in practice, because the policy was implemented and then reversed within three years, allowing measurement of both its effects and the effects of its removal.
Research by economists Frank Jotzo and colleagues at the Australian National University, published in Nature Climate Change in 2016, found that Australian electricity sector greenhouse gas emissions fell by 7% in the first year of the carbon price, the largest single-year decline since recording began, driven primarily by fuel switching from coal to gas generation in electricity production.
The carbon price created a negative feedback loop: higher carbon emissions meant higher costs, incentivizing emission reductions that reduced costs. When the policy was repealed, emissions increased by 9% over the subsequent twelve months as generators switched back to coal.
The case demonstrated both the effectiveness of price-based feedback mechanisms in driving emission reductions and the asymmetry in feedback loop effects: the reduction took one year to materialize but the rebound occurred within twelve months of the price's removal, consistent with feedback theory predictions about how quickly systems return to prior equilibria when corrective feedback is removed.
Wikipedia's Self-Correcting Feedback Architecture (2001-present). Wikipedia's remarkable stability and accuracy, despite having no editorial staff and being editable by any user, has been studied extensively as a case of emergent order maintained through feedback loops.
Research by Andrew Lih, published in his 2009 book The Wikipedia Revolution, and by academic researchers including Brian Keegan at Harvard, documented the specific feedback mechanisms: the vandalism-revert loop (vandalism is detected by automated bots and human patrollers who revert it, discouraging repeat vandalism through futility), the article quality feedback loop (article weaknesses are flagged with maintenance templates visible to readers and editors, directing editing effort toward problem areas), and the editor reputation loop (experienced editors gain additional privileges while editors who repeatedly violate policies lose privileges, selecting for prosocial editing behavior).
A 2018 study by Morten Warncke-Wang and colleagues, published in ACM Transactions on the Web, analyzed 318 million edits and found that Wikipedia's error correction rate for factual inaccuracies had improved continuously from 2004 to 2018, with the median time to correction of a factual error falling from approximately 15 days in 2004 to less than 2 days by 2018.
A 2005 Nature study comparing Wikipedia to Encyclopaedia Britannica on 42 science articles found similar average error rates (4.0 per article for Wikipedia versus 2.9 for Britannica), suggesting that distributed feedback-based quality control produced accuracy comparable to professional editorial processes at a fraction of the cost.
Word count: 6,891 words
Frequently Asked Questions
What is a feedback loop?
System where output influences future input, creating cycle that either amplifies (reinforcing) or dampens (balancing) change.
What's a reinforcing feedback loop?
Amplifying cycle, more begets more. Examples: compound interest, viral growth, panic, or network effects. Creates exponential change.
What's a balancing feedback loop?
Self-correcting cycle, pushes toward equilibrium. Examples: thermostat, supply-demand, or homeostasis. Creates stability.
Why do feedback loops matter?
They create non-linear behavior, delays, oscillation, and emergence, make systems behave in non-obvious ways.
What's the difference between positive and negative feedback?
Positive = reinforcing (amplifying change). Negative = balancing (dampening change). Confusing because ‘negative’ doesn’t mean bad.
How do delays affect feedback loops?
Create oscillation, overshoot, or instability, when action and consequence separated in time, hard to connect cause and effect.
Can you have multiple feedback loops?
Yes, most systems have many interacting loops. Understanding which dominates when is key to understanding system behavior.
How do you identify feedback loops?
Trace how A affects B affects C… and eventually back to A. Look for cycles in causation, not just linear chains.