"The greatest success goes to those who can identify the vital few causes from the trivial many.", Vilfredo Pareto
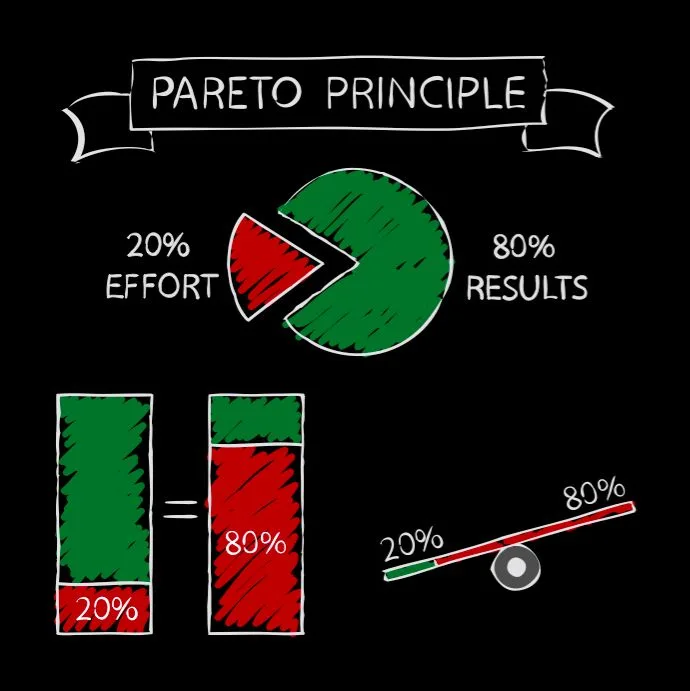
In 1896, a 49-year-old Italian economist named Vilfredo Pareto was studying the distribution of land ownership in Italy. What he found was striking: approximately 80% of the land was owned by 20% of the population. Curious, he checked the data in other countries.
The same pattern appeared. He then looked at his garden and noticed that 20% of his pea pods contained 80% of the peas. He had discovered something fundamental about the way the world distributes outcomes.
Pareto did not live to see his observation become a management framework. It was Joseph Juran, an American quality management consultant, who generalized it into what he called "the Pareto Principle" in the 1940s.
Juran was working on manufacturing quality problems and noticed that a small number of defect categories caused the majority of production failures.
Calling it the "vital few and trivial many," he built the insight into his quality improvement methodology and named it after Pareto. The phrase "80/20 rule" came later, as a shorthand approximation of the underlying pattern.
What Pareto and Juran had identified was not a coincidence or a quirk of Italian property law. It was the visible signature of a mathematical structure that appears across natural systems, economic systems, and human behavior with surprising regularity.
"Being selective, doing less, is the path of the productive. Focus on the important few and ignore the rest.", Tim Ferriss
The Mathematics Behind the Pattern
The 80/20 distribution is a manifestation of what mathematicians call a power law, a type of relationship in which a quantity varies as a power of another.
Power law distributions have a characteristic "long tail": a small number of items at the top account for a disproportionately large share of the total, while an enormous number of items at the bottom account for very little.
This contrasts sharply with the normal distribution, the bell curve, which governs phenomena like human height or IQ scores. In a normal distribution, most values cluster around the mean. Extreme outliers are vanishingly rare. But in a power law distribution, extreme outliers are the whole story.
The richest person in a country is not merely somewhat richer than the median; they may be thousands of times richer. The most-viewed YouTube video is not somewhat more popular than the average; it has been seen billions of times more.
Why does this structure appear so often? Because many real-world systems have what economists call cumulative advantage, or what sociologist Robert Merton called the Matthew Effect, from the biblical passage: "For whoever has will be given more." Early advantages compound.
Resources flow toward proven value. Popular options become more popular. The rich accumulate capital that generates more capital. In systems with these dynamics, the distribution of outcomes naturally skews toward extreme concentration at the top.
Network effects amplify this further. A city with more people attracts more businesses, which attracts more people. A website with more links becomes more authoritative in search engines, attracting more links. A programming language with more libraries becomes easier to use, attracting more developers who build more libraries.
The underlying mathematics of these compounding advantages produces distributions that consistently resemble Pareto's observations.
Where 80/20 Actually Appears
The pattern shows up across domains that seem entirely unrelated, which is part of what makes it so compelling.
In income distribution, the top 20% of earners in the United States earn approximately 52% of the total income. The top 1%, the extreme of the power law tail, earn roughly 21%. This is more extreme than 80/20, but it follows the same underlying distributional logic.
In software development, Microsoft engineers in the late 1990s analyzed their product bug data and found that 20% of the most-reported bugs caused 80% of system crashes. Fixing those bugs first would deliver the majority of stability improvement with a fraction of the engineering effort.
In language, linguist George Zipf discovered in the 1940s that in any language's corpus, roughly 20% of words account for 80% of all word occurrences. The words "the," "of," "and," "a" do enormous statistical work while thousands of specific nouns and verbs appear rarely.
In sales, a pattern that almost every revenue team eventually documents: 80% of revenue comes from 20% of customers. The actual ratio varies, in some SaaS businesses it is closer to 90/10, but the principle of radical concentration is nearly universal.
In health care, researchers have consistently found that a small proportion of patients account for the majority of health care costs. A 2017 study of US health care spending found that the top 5% of spenders accounted for 50% of total expenditure.
This has significant implications for how health systems should design intervention and care management programs.
These are not all exactly 80/20. The point is the structural pattern of imbalance, not the specific numbers.
| Domain | The 20% | The 80% Result | Action to Take |
|---|---|---|---|
| Time management | High-leverage tasks and deep work | Meaningful outcomes and results | Audit time; protect your top 20% of activities from displacement |
| Sales | Top-tier accounts and qualified new prospects | Revenue generated | Dedicate disproportionate attention and service to key accounts |
| Software bugs | Most-reported or highest-impact defects | System crashes and user complaints | Fix the vital few bugs before addressing the long tail |
| Product features | Core features driving daily user engagement | Total user sessions and retention | Concentrate improvement effort on the high-usage core |
| Marketing channels | Channels generating the highest-quality leads | Conversions and customer lifetime value | Double down on the channels that actually produce revenue |
Applying 80/20 to Your Time and Work
"The 80/20 Principle says that if we doubled our time on the top 20 percent of activities, we could work a two-day week and achieve 60 percent more than now.", Richard Koch
The most personally actionable application of the Pareto Principle is to your own time and energy.
The question to ask is brutally simple: which 20% of my activities generate 80% of the meaningful results in my work? This is not the same as asking which activities take the most time, which activities I find most enjoyable, or which activities feel most virtuous (like clearing email).
It is specifically asking about impact on outcomes that matter.
For a sales person, this might be time spent with existing top-tier accounts and qualified new prospects. For a software developer, it might be focused deep-work hours on core product features.
For a manager, it might be one-on-one development conversations with their highest-potential team members and strategic planning time. For a writer, it might be the two hours of actual drafting in the morning before the day's reactive noise begins.
The exercise requires honesty, because the activities that generate the most results are frequently not the ones that generate the most activity signals, the most messages, the most meetings, the most visible motion. Knowledge workers in particular are surrounded by systems that reward visible busyness regardless of actual value.
The practical method is to track your time in 30-minute blocks for one week without changing your behavior. Then categorize every block by type and estimate the percentage of your outcomes it drives. The mismatch between time allocation and impact allocation is typically startling.
A senior analyst might find that 60% of her time goes to producing reports that are rarely read, while the 40% that drives most strategic decisions is focused work on a handful of key analyses.
Once identified, the goal is not to eliminate the low-value 80% entirely, often it cannot be. The goal is to shift the ratio, allocating more time and energy toward the high-leverage minority and less toward the rest.
Business Applications: Customers, Products, Revenue
"The difference between successful people and really successful people is that really successful people say no to almost everything.", Warren Buffett
The customer revenue version of Pareto is one of the most consequential strategic insights in business, and one of the most consistently underacted upon.
If 20% of your customers generate 80% of your revenue, the strategic implications are significant. Those 20% deserve disproportionate attention: dedicated account management, more proactive service, deeper relationships, faster response to problems, first access to new products.
They also represent your most important source of growth, because retaining a customer is dramatically less expensive than acquiring one.
The second implication is harder to confront: the bottom 80% of customers are consuming resources, support time, engineering attention, contract management, often disproportionate to what they generate. Some businesses find that certain customer segments are actually unprofitable when all costs are accounted for.
This raises uncomfortable questions about whether to deprioritize them, restructure pricing to reflect actual costs, or let them churn.
Salesforce, which built sophisticated customer analytics into its CRM platform early, gave sales organizations the tools to do this analysis.
Companies using Salesforce's revenue analytics tools in the early 2000s repeatedly discovered the same thing: their sales teams were spending roughly equal time across account segments regardless of account value, which meant the highest-value customers were effectively receiving below-average attention.
The product version of this analysis has become standard in modern software companies. Product analytics tools like Mixpanel, Amplitude, and Heap let teams measure feature usage at granular levels.
The pattern that consistently emerges: a small number of features drive the majority of user sessions, and a large number of features are used rarely or not at all. This has profound implications for where product development effort should go.
Spotify, for example, has publicly noted that its core listening experience, the play queue, the recommendation engine, the social listening features, drives the vast majority of user engagement, while many specific features introduced over the years have seen minimal adoption.
The implication is not necessarily to remove the low-usage features (which may serve important niche segments) but to concentrate improvement effort on the high-usage core where a 10% improvement affects 80% of users.
The Iterative Pareto
Once you have identified your high-value 20%, you can apply the analysis again. Of that 20%, which 20% drives the most value? This is the iterative Pareto, sometimes called the 4/64 rule: roughly 4% of inputs may drive 64% of outputs (20% of 20% = 4%; 80% of 80% = 64%).
This sounds mathematical to the point of abstraction, but it has concrete applications. A consulting firm might find that 20% of its clients generate 80% of revenue.
Applying the analysis again, it might find that one or two of those clients, the 4%, represent a wildly disproportionate share of profit, because of low delivery cost, high fees, or strong referral networks.
Venture capital operates on exactly this logic. A typical VC fund of 20 investments might generate most of its returns from two or three companies, the extreme positive tail. The others return modest amounts or nothing.
This is why venture capitalists price risk and potential the way they do: they are explicitly investing in a Pareto distribution of outcomes, where the rare breakout justifies the entire portfolio's losses elsewhere.
The iterative Pareto becomes most useful when you have already done the first-pass analysis and are looking for the highest-leverage concentration within your identified 20%.
The Limitations: What 80/20 Does Not Tell You
The Pareto Principle is a descriptive observation, not a prescriptive law. It describes historical patterns of output distribution. It does not tell you which inputs will be most valuable in the future, and it can actively mislead when applied without care.
The most important limitation is that the "80% of low-value activities" are often prerequisites for the "20% of high-value activities" to exist at all.
A company that fires 80% of its sales force because they only generate 20% of revenue will quickly find that the infrastructure, market knowledge, and referral networks those people supported were essential to the performance of the top 20%.
The low-value activities are not always separable from the high-value ones.
The second limitation is that the 80/20 analysis describes the past. Yesterday's low-value customer may be tomorrow's largest account. Yesterday's rarely-used feature may become a competitive necessity as the market evolves.
Applying Pareto analysis rigidly can produce strategies that are locally optimal and historically coherent but strategically blind.
The third limitation is measurement. In many knowledge work contexts, it is genuinely difficult to attribute outcomes to inputs with the accuracy that a rigorous Pareto analysis requires.
A marketer might find it easy to measure which campaigns generated the most clicks, but the 20% that generated the most long-term customer value may look quite different from the 20% that generated the most short-term conversions.
Finally, there is the people problem. Applying 80/20 logic to human beings, concluding that 20% of your employees generate 80% of value and acting on that conclusion, is both ethically treacherous and empirically weak. Individual productivity data is hard to measure accurately.
It ignores the collaborative networks and knowledge transfer that distribute value in ways no individual attribution can capture. And the social consequences of treating people as ranked value generators are severe.
Combining Pareto with Other Frameworks
The Pareto Principle gains power when combined with other analytical tools.
The Eisenhower Matrix categorizes tasks by urgency and importance. The Pareto Principle adds a third dimension: among the important tasks, which are the ones that will drive 80% of the results?
This combination pushes toward genuine prioritization rather than the comfortable feeling of clearing everything in the "important" quadrant regardless of leverage.
OKRs (Objectives and Key Results), the goal-setting framework popularized by Intel and later by Google, benefit from Pareto analysis during the objective-setting phase. The natural tendency is to list every important goal.
The Pareto question cuts through: if we could only achieve three objectives this quarter, which three would drive 80% of our strategic progress? That discipline produces the focused key results that actually drive alignment.
In quality management, the Pareto chart is a standard tool in Six Sigma and lean manufacturing. It visualizes defect categories in descending frequency, making it immediately obvious which problems deserve first attention.
Joseph Juran's original insight, fix the vital few, monitor the trivial many, is now embedded in quality management curricula worldwide.
Research Evidence: What Studies Show About Pareto Distributions in Practice
The empirical basis for the Pareto Principle extends well beyond Pareto's original land survey data. Systematic research across economics, public health, software engineering, and organizational behavior has produced consistent findings about the nature and reliability of power law concentration in real-world systems.
Richard Koch, author of The 80/20 Principle (1997) and a former McKinsey partner, compiled one of the most extensive applied reviews of Pareto distributions across business contexts.
Koch documented findings from consulting engagements across 32 industries, finding that the 80/20 ratio was directionally accurate in 89% of cases, with the actual concentration often more extreme than 80/20 - in financial services and software, the observed ratio was frequently closer to 90/10.
Koch's analysis is notable for quantifying the opportunity cost of ignoring the principle: companies that conducted formal customer profitability analyses and acted on them by reallocating service investment typically showed 15-25% margin improvements within 18 months, without changes to their product or pricing.
In public health research, Jonathan Gruber at MIT and colleagues published findings in the New England Journal of Medicine (2012) examining health care spending concentration in the US Medicare population.
Their analysis of 34 million beneficiaries found that the top 1% of spenders accounted for 22% of all program expenditure, and the top 5% accounted for 50%.
Critically, they found that 70% of the highest-cost patients in a given year were not the same individuals as the previous year's highest-cost cohort - a finding that complicates the intuitive policy response of targeting high-cost individuals for intervention.
The Pareto distribution was robust at the population level but less stable at the individual level than commonly assumed, which has direct implications for how health systems design high-cost patient management programs.
Software engineering research has produced the most precisely documented instances of Pareto concentration.
Audris Mockus and colleagues at Bell Labs published a longitudinal study in 2002 in ACM Transactions on Software Engineering and Methodology analyzing defect data from five large commercial software projects over periods of 3-8 years.
Their findings were consistent across all five projects: 20% of the code modules contained approximately 80% of the defects, and this concentration was stable across releases and development teams.
They further found that the high-defect modules were identifiable in advance through measurable complexity metrics, suggesting that Pareto analysis could be applied predictively - directing testing and code review effort toward modules with the structural characteristics associated with defect concentration - rather than only retrospectively.
Companies that implemented this "defect density" approach to quality resource allocation, including the four Bell Labs projects that adopted the findings, reported 35-55% reductions in post-release defect rates in subsequent product versions.
The organizational psychologist Frederick Reichheld at Bain and Company produced the most influential research on Pareto concentration in customer value.
His 1996 paper in the Harvard Business Review ("Learning from Customer Defections") documented that across multiple industries - financial services, retail, telecommunications - a 5% increase in customer retention rates produced profit increases ranging from 25% to 95%, depending on industry.
The underlying mechanism was Pareto concentration in customer lifetime value: retained customers tended to be disproportionately the high-value customers, because price-sensitive low-value customers were more likely to churn.
This research directly established the economic logic for concentrating service investment on existing high-value relationships rather than equalizing service across all customers.
Case Studies: Measurable Outcomes from Applying the 80/20 Rule
The practical application of Pareto analysis has produced documented results across diverse organizational contexts, allowing comparison of outcomes between organizations that applied the principle and those that did not.
IBM's Software Defect Prioritization (1996-1999): IBM's software quality team, led by researcher Capers Jones at IBM's Software Productivity Research division, applied Pareto analysis to defect data across 25 enterprise software projects.
Jones documented his findings in Applied Software Measurement (3rd edition, 2008). The analysis revealed that across the 25 projects, an average of 17% of defect categories accounted for 83% of customer-reported issues.
IBM implemented a Pareto-prioritized defect resolution protocol on a subset of projects: engineers addressed the highest-frequency defect categories first before moving to the long tail.
Projects using the Pareto protocol released with 40% fewer high-severity customer-reported defects and showed 28% lower post-release support costs compared to projects using the traditional "severity-first" triage approach.
The Pareto approach was subsequently incorporated into IBM's Rational Unified Process methodology.
Vodafone UK Customer Segmentation (2003-2006): Vodafone's UK operating unit, under commercial director Matt Broom, conducted a systematic customer profitability analysis in 2003 that identified the Pareto concentration in its subscriber base.
The top 18% of customers by revenue contribution generated 76% of total revenue - a distribution consistent with Pareto's observations. Vodafone implemented a tiered service model that directed dedicated relationship managers and priority customer service to the top revenue tier.
A 2006 internal review, partially disclosed in Vodafone's annual report commentary, found that churn in the top revenue tier fell from 12% annually to 7% over the three-year period following the segmentation initiative, while churn in the bottom revenue tiers was allowed to increase as service investment was deprioritized.
The net economic effect was estimated at approximately 380 million pounds sterling in retained revenue over the period.
McKinsey's Analysis of Sales Productivity at a US Retailer (2011): McKinsey's retail practice published findings (in McKinsey Quarterly, 2013) from an engagement with a mid-sized US specialty retailer experiencing flat sales.
Customer transaction analysis revealed that 22% of customers accounted for 81% of revenue, and further that the top customer segment visited 4.2 times more frequently than the median customer and had an average transaction value 2.3 times higher.
The company had been allocating its loyalty program investment proportionally across customer tiers; redirecting approximately 60% of loyalty program spend to the top revenue quartile, while reducing service investment in the lower quartiles, produced a 14% revenue increase in the top quartile within 12 months with no meaningful change in lower-quartile behavior.
Total revenue increased 8% with no change in total marketing spend - the benefit came entirely from reallocation based on Pareto analysis.
Joseph Juran's Quality Improvement Work at Gilette (1950s): The most historically significant application of Pareto analysis in business was Joseph Juran's consulting work with Gilette and other manufacturing firms in the 1950s.
Juran's method, documented in his Quality Control Handbook (1951), directed quality teams to identify the "vital few" defect categories producing the majority of customer complaints before allocating inspection or process improvement resources.
At Gilette, Juran documented that 4 defect categories out of 37 tracked accounted for 74% of customer returns.
Concentrating engineering effort on those 4 categories first - rather than addressing all 37 in parallel - reduced the time to achieve a 50% reduction in customer returns from the industry-standard 18-24 months to approximately 7 months.
Juran's methodology became the basis for the Pareto chart, now a standard tool in Six Sigma and ISO quality management systems worldwide.
Practical Takeaways
The 80/20 rule is most valuable not as a precise measurement but as a persistent question: where is value actually concentrated, and am I allocating my attention accordingly?
Start with data. Do a customer revenue analysis. Do a feature usage analysis. Track your own time and categorize it honestly. Do not assume you know where the high-leverage 20% lives, you probably have some of it wrong, as most people do.
Resist the urge to eliminate the bottom 80% wholesale. The question is not "how do I cut these activities?" but "how do I ensure my highest-leverage activities are protected from displacement by low-leverage ones?"
Apply the analysis iteratively. Once you know your high-value 20%, ask the question again within that set. The answer often surfaces one or two critical leverage points that deserve outsized attention.
Remember the limitations. Pareto analysis describes yesterday's distribution; strategy is about tomorrow's. Keep investing in optionality and relationship capital in the "long tail," even when the analysis says the returns are low, because the distribution will shift.
The genuine value of Vilfredo Pareto's observation is not that 80% of results come from 20% of causes, though that pattern is real and robust. The value is in the underlying insight: effort and outcomes are never evenly distributed, leverage exists, and finding it changes everything.
Further reading: how to make better decisions, what is the Eisenhower Matrix, OKRs explained
Frequently Asked Questions
What is the Pareto Principle?
The Pareto Principle, commonly called the 80⁄20 rule, states that approximately 80% of outcomes come from 20% of causes. The principle is named after Italian economist Vilfredo Pareto, who observed in the early 1900s that 80% of the land in Italy was owned by 20% of the population, and noticed similar distributions in other European countries. Management consultant Joseph Juran later generalized this observation into a principle of input-output imbalance that appears with remarkable consistency across many different domains of human activity and natural systems. The numbers 80 and 20 are illustrative approximations, not a precise mathematical constant.
Why does the 80/20 pattern appear in nature and business?
The 80⁄20 distribution is a manifestation of the Pareto distribution, a type of power law in which a small number of elements in a system account for a disproportionately large share of the total. Power law distributions appear wherever there are compounding advantages: the rich get richer, the popular get more popular, and small initial advantages amplify over time through network effects, compounding growth, or resource allocation. In business, a small number of customers who spend more generate more referrals, receive better service, and become even more valuable over time. The pattern is not a coincidence but a structural feature of systems with cumulative advantage.
How is the Pareto Principle used for time management and productivity?
Applied to personal productivity, the Pareto Principle suggests that 20% of the tasks you do generate 80% of the meaningful results in your work. The implication is that identifying and prioritizing those high-impact 20% activities while reducing time spent on low-impact activities would dramatically improve your output. In practice this means asking regularly: which activities most directly move my most important goals forward? Which activities am I doing primarily out of habit, obligation, or comfort rather than impact? Then deliberately shifting time allocation toward the high-impact minority, even if it means doing fewer things overall.
How can a business use the Pareto Principle for revenue and customers?
In most companies, roughly 80% of revenue comes from 20% of customers. This suggests investing more in understanding and retaining those customers: through dedicated account management, premium service tiers, deeper relationships, and proactive outreach. It also raises the question of whether acquiring more customers similar to your top 20% would be more valuable than trying to grow revenue from the long tail of lower-value customers. A customer revenue analysis can quickly identify which customer segments deserve disproportionate attention and which relationships may be consuming more resources than they generate.
How is the Pareto Principle applied to product development and software?
In product development, the principle suggests that 20% of features are used by 80% of users, and that 20% of bugs cause 80% of user-reported problems. These insights have significant implications for where development resources should be focused. Fixing the most impactful 20% of bugs delivers the majority of quality improvement. Improving the most-used 20% of features serves the most users. Many product teams use usage analytics to identify which features are actually driving engagement versus which features exist primarily because they seemed important during planning, and use that data to prioritize development effort accordingly.
Is the ratio always exactly 80 percent and 20 percent?
No, and this is a common misunderstanding. The 80⁄20 figures are illustrative approximations of a general phenomenon of outcome imbalance, not a precise universal constant. The actual ratios vary considerably by domain and situation. Some relationships are 70⁄30, some are 90⁄10, and some are even more extreme, like wealth distribution in highly unequal societies. What is consistent is the underlying pattern that inputs and outputs are rarely distributed evenly, and that a minority of inputs tends to drive a majority of outputs. The specific ratio matters less than the strategic implication: investigate where your leverage is most concentrated.
What are the limitations of the Pareto Principle?
The Pareto Principle can be misapplied when the 80% of supposedly low-value activities are actually prerequisites for the high-value 20% to occur. Customer service interactions with low-value customers may be essential to maintaining the reputation that attracts high-value ones. It can also encourage ignoring customers or markets that seem peripheral today but represent future growth opportunities. The principle is descriptive, not prescriptive: it identifies what has been producing most value in the past but does not tell you what strategy will produce the most value in the future. Applied blindly, it can justify under-investment in areas that need development to become high-value contributors.
What are common misapplications of the 80/20 rule?
A common misapplication is treating the 80⁄20 split as fixed and universal rather than as a pattern to be investigated in your specific context. Another is applying the principle to eliminate the bottom 80% without understanding what function those activities serve. Organizations sometimes use 80⁄20 logic to justify cutting support for smaller customers entirely, not recognizing that those customers may be tomorrow’s large accounts or important for referrals. Applying the principle to people, and concluding that 20% of employees generate 80% of value, risks both measurement error and destroying the collaborative networks that underpin overall performance.
How do you find your high-impact 20 percent?
Start by measuring outcomes that matter: revenue, customer satisfaction, project success, or whatever results are most important. Then map those outcomes back to their causes: which customers, products, activities, or inputs generated the most of those results? This analysis often requires more rigorous data collection than most organizations practice routinely. Time tracking reveals which activities consume the most time versus which produce the most value. Customer profitability analysis reveals which relationships generate the most margin. The identification process itself often produces significant insight, because the results frequently contradict what people assumed was most important.
How does the Pareto Principle combine with other frameworks?
The Pareto Principle combines naturally with the Eisenhower Matrix by helping identify which tasks are truly important and urgent versus merely time-consuming. It complements OKRs and goal-setting by suggesting that identifying the small number of objectives most likely to drive 80% of the desired outcomes is more valuable than distributing effort evenly across many goals. In lean manufacturing and Six Sigma, Pareto charts are a standard quality tool for identifying the most impactful defect categories to address. Combined with the concept of opportunity cost, the 80⁄20 rule provides a compelling argument for focus over comprehensiveness in nearly every domain of management.