DevOps: In June 2009, John Allspaw and Paul Hammond presented a talk at the Velocity Conference titled "10+ Deploys Per Day: Dev and Ops Cooperation at Flickr." The presentation had 46 slides.
The audience of several hundred conference attendees would later describe it as the moment that changed how they thought about software operations.
Most organizations at that time deployed software monthly or quarterly---treating each release as a high-stakes event that required change approval boards, frozen code windows, and manual verification by separate QA teams.
The idea that Flickr deployed ten or more times per day was not just unusual. It was, to many attendees, incomprehensible. How could you deploy so frequently without constant instability? The answer Allspaw and Hammond gave was not a technology.
It was a relationship: developers and operations engineers working together throughout the entire software lifecycle, sharing accountability for both building software and running it in production.
That presentation is widely credited with launching the DevOps movement. Its core observation---that the biggest bottleneck in software delivery is organizational rather than technical---remains as true today as it was in 2009.
What DevOps Actually Is
DevOps is frequently misunderstood as a job title, a set of tools, or a synonym for continuous deployment. It is none of these things, though it involves all of them.
DevOps is a set of practices and cultural values that breaks down the traditional separation between software development (Dev, writing code) and IT operations (Ops, running systems in production).
In traditional organizations, developers write code and "throw it over the wall" to operations, who are responsible for deploying it, keeping it running, and handling production incidents. This separation creates structurally misaligned incentives.
Developers are measured on feature velocity---how many features they ship. Operations engineers are measured on stability---how little changes in production. These incentives are in direct conflict: developers want to change things; operations wants things to stay the same.
The result is friction, slow deployments, and a blame cycle when things go wrong. When a production incident occurs, developers say "operations deployed it wrong" and operations says "development wrote broken code." Neither learns from the failure; both protect their boundaries.
DevOps realigns these incentives through shared ownership and end-to-end accountability. Teams that build software also operate it. They deploy it, monitor it, respond to incidents, and learn from failures.
When you are responsible for running your code in production at 3 AM, you write more reliable code, invest in monitoring, and care about operational concerns from the beginning of development rather than the end.
The research supports this. Google's DevOps Research and Assessment (DORA) team has studied software delivery performance across thousands of organizations since 2014.
High-performing DevOps organizations deploy more frequently, recover faster, and have lower change failure rates than low performers - not because they take fewer risks, but because their practices make each individual change smaller, safer, and more reversible.
Their findings, published in Accelerate (2018), show that high-performing DevOps organizations deploy 208 times more frequently than low performers, with 106 times faster lead time for changes and 7 times lower change failure rates.
The highest-performing organizations achieve both higher deployment frequency AND higher stability---directly contradicting the traditional assumption that speed and stability trade off against each other.
Core Principles
The Three Ways
Gene Kim, co-author of The DevOps Handbook and The Phoenix Project, articulated the three foundational principles as "The Three Ways":
The First Way: Flow --- Optimize the left-to-right flow of work from development through operations to customers. Reduce work-in-progress, eliminate waste, and accelerate the delivery of value. Every unnecessary step, every manual handoff, every batch size reduction makes flow faster.
The Second Way: Feedback --- Create right-to-left feedback loops at every stage. Fast feedback from production tells developers what is working. Fast feedback from automated tests tells developers what is broken. Fast feedback from monitoring tells operators what is degrading. The faster the feedback, the faster the learning.
The Third Way: Continual Learning and Experimentation --- Create a culture that fosters continual learning from failures rather than blame. Allocate time for improvement work. Reward risk-taking and experimentation. Treat failures as learning opportunities rather than events requiring punishment.
Shared Ownership
The organizational foundation: the people who build software share responsibility for running it. This does not mean developers become system administrators. It means the boundary that separates "building" from "running" is dissolved, and teams have end-to-end accountability for their services.
Shared ownership manifests practically:
- Developers participate in on-call rotations for services they build
- Operations engineers participate in architecture and design reviews
- Incident response draws on both development and operational perspectives
- Shared metrics measure service health (user-facing outcomes) rather than team activity (number of tickets closed)
Example: Amazon famously practices "you build it, you run it." Every service team owns their service end-to-end---deployment, monitoring, incident response, and on-call pager duty.
The result is that teams have strong incentives to build reliable, well-monitored services because they personally experience the consequences of unreliability at 3 AM.
Small Batches and Frequent Delivery
Large deployments are risky deployments. When a release changes thousands of lines of code across dozens of features, debugging failures is difficult, rollback affects all changes simultaneously, and the psychological weight of the release creates anxiety that slows the process further.
Small, frequent deployments are safer. A deployment that changes 50 lines of code is easy to understand, easy to test, and easy to roll back if it causes problems. When deployments happen ten times per day instead of once per quarter, each deployment is trivially small.
Individual deployments become boring---exactly what you want them to be.
This principle connects to batch size theory from manufacturing, particularly the Toyota Production System. Smaller batches move through the system faster, accumulate less work-in-progress, and reveal problems earlier when they are cheaper to fix.
The Five Key Practices
Practice 1: Continuous Integration and Delivery
Continuous Integration (CI) is the practice of frequently merging code changes from multiple developers into a shared repository, with each merge triggering automated building and testing. Developers merge to the main branch multiple times per day rather than maintaining long-lived feature branches.
Continuous Delivery (CD) extends CI by ensuring the software is always in a deployable state. Every commit that passes automated tests is a candidate for production deployment. The decision to deploy is a business decision, not a technical ordeal.
CI/CD is the technical backbone of DevOps. CI/CD pipelines automate the repetitive, error-prone work of building, testing, and deploying software, allowing engineering teams to focus on the creative work of solving problems.
Practice 2: Infrastructure as Code
Infrastructure as Code (IaC) means defining servers, networks, databases, load balancers, and all infrastructure in code files rather than configuring them manually through web consoles or command-line sessions.
The transformation is significant:
- Infrastructure changes are version-controlled, reviewed, and audited just like application code
- Environments are reproducible: the same IaC configuration creates identical environments, eliminating "it worked in staging" mysteries
- Provisioning is automated: creating a new environment takes minutes, not days or weeks
- Infrastructure is self-documenting: the code describes exactly what exists and why
Example: Stripe manages their infrastructure using Terraform. Every AWS resource---EC2 instances, RDS databases, VPCs, security groups, IAM roles---is defined in Terraform configuration files stored in their version control system.
When Stripe needs to create a new environment or replicate infrastructure for testing, they run Terraform and the entire environment is created consistently in minutes.
For a deep exploration of techniques and tooling, Infrastructure as Code covers Terraform, CloudFormation, Pulumi, and the patterns that make IaC effective at scale.
Practice 3: Monitoring and Observability
You cannot improve what you cannot see. You cannot debug what you cannot observe. Monitoring and observability provide the data that makes DevOps practices effective.
Monitoring answers "is the system healthy?" It provides metrics: CPU usage, error rates, response times, queue depths. Monitoring tells you when something is wrong.
Observability answers "why is the system unhealthy?" It provides context: distributed traces showing where a request slowed down, structured logs showing the specific error that occurred, correlation between metrics that reveals causation. Observability tells you what is wrong.
The practical stack for modern observability:
Metrics: Time-series data collected at regular intervals. Prometheus (open-source) and Datadog (commercial) are the dominant platforms. Metrics power dashboards and alert on threshold violations.
Logging: Structured event records from applications and infrastructure. Elasticsearch/Logstash/Kibana (ELK stack), Splunk, and Grafana Loki aggregate logs across distributed systems for search and analysis.
Distributed tracing: Records the path of requests through distributed microservices. Jaeger (open-source), Tempo, and Datadog APM show exactly which service caused a performance problem in a chain of ten service calls.
Alerting: Notifies the right people when metrics exceed thresholds. PagerDuty, Opsgenie, and Grafana Alerting route alerts to on-call engineers based on schedules and severity.
Example: Netflix processes billions of metrics per day from their global streaming infrastructure.
Their observability platform (Atlas for metrics, Edgar for distributed tracing) allows engineers to identify the cause of a streaming quality degradation in a specific geographic region within minutes of it starting, often before users report it.
Alerts require careful design. Too few alerts means problems go undetected. Too many alerts creates "alert fatigue"---engineers learn to ignore the noise, missing critical signals. Well-designed alerting fires only when human intervention is genuinely required.
Practice 4: Blameless Post-Mortems and Learning from Failure
Production incidents are inevitable in any complex system. The difference between organizations that improve from incidents and organizations that repeat them is how they respond.
Blameless post-mortems (also called incident retrospectives or after-action reviews) examine what happened, why it happened, what was done to respond, and what changes would prevent recurrence.
The "blameless" aspect is not about avoiding accountability---it is about recognizing that blaming individuals prevents the organization from learning.
When an engineer causes an incident, they did so within an organizational system that allowed it to happen. The engineer may have clicked the wrong button, but why was clicking that button possible? Why was there no confirmation dialog? Why was the command runnable on production?
Why did no monitoring catch the problem before it reached users? These systemic questions reveal fixable issues; blaming the individual does not.
Google's SRE team has practiced blameless post-mortems since the early 2000s. Their published incident reports are remarkably candid: they describe exactly what went wrong, including engineer actions that contributed to incidents, without assigning personal blame. The goal is organizational learning and systemic improvement.
Post-mortem structure:
- Timeline: What happened, in chronological order, with exact timestamps
- Root cause analysis: What technical, process, or organizational factors caused the incident
- Impact: How many users were affected, for how long, with what consequences
- Detection: How was the incident discovered? How could it have been detected sooner?
- Response: What was done to mitigate and resolve? What worked? What slowed the response?
- Action items: Specific, owned, dated tasks to prevent recurrence and improve detection/response
The action items are the most important output. A post-mortem that produces "we should be more careful" has failed. A post-mortem that produces "add automated schema compatibility checking to the deployment pipeline (owner: Jane, due: March 15)" creates tangible improvement.
Practice 5: Deployment Automation and Continuous Deployment
Deployment should be boring. The goal is to make releasing software so routine, so automated, and so low-risk that it becomes an unremarkable daily activity rather than a high-stakes event.
Manual deployments are:
- Slow (humans are slower than automation)
- Variable (the same steps are performed slightly differently each time)
- Error-prone (humans make mistakes, especially under pressure)
- Undocumented (the "deployment process" lives in someone's head)
Automated deployments are:
- Fast (automation executes in seconds what takes humans hours)
- Consistent (the same process executes the same way every time)
- Reliable (no fat-finger errors, no missed steps)
- Documented (the deployment script is the documentation)
For details on the strategies that govern how new code reaches production safely, deployment strategies covers rolling deployments, blue-green deployments, canary releases, and the database migration patterns that make zero-downtime deployments possible.
The DORA Metrics: Measuring DevOps Performance
The DORA (DevOps Research and Assessment) research program, now part of Google, identified four metrics that reliably predict organizational performance:
Deployment Frequency: How often code is deployed to production.
Lead Time for Changes: Time from code committed to running in production.
Change Failure Rate: Percentage of deployments that require a hotfix or rollback.
Mean Time to Restore (MTTR): How long it takes to recover from a production failure.
The research finding that has most challenged conventional wisdom: high deployment frequency and high stability are positively correlated, not negatively. Organizations that deploy more frequently have lower failure rates and faster recovery times. The intuition that "moving slower is safer" is empirically wrong.
This result emerges from the mechanics of batch size: organizations that deploy frequently deploy small changes. Small changes are easy to understand, test, and roll back. Organizations that deploy infrequently accumulate large changes. Large changes are risky, difficult to debug, and frightening to roll back.
DORA research classifies organizations into four performance tiers:
| Tier | Deployment Frequency | Lead Time | Change Failure Rate | MTTR |
|---|---|---|---|---|
| Elite | Multiple/day | < 1 hour | 0-15% | < 1 hour |
| High | Weekly | 1 day - 1 week | 16-30% | < 1 day |
| Medium | Monthly | 1 week - 1 month | 16-30% | < 1 week |
| Low | < 6 months | 1-6 months | 16-30% | 1-6 months |
Elite performers are not rare---they represent roughly 20% of organizations surveyed. The practices that separate elite from low performers are consistent: comprehensive CI/CD, loosely coupled architectures, trunk-based development, automated testing, and strong monitoring.
Common Obstacles and How to Address Them
Organizational Silos
The most common and most difficult obstacle. Organizations divided into separate development, QA, security, and operations departments with different management chains have structurally misaligned incentives that tools cannot fix.
Breaking silos requires executive support, organizational restructuring, and sustained effort over years. The pragmatic path: start with cross-functional teams organized around specific products or services rather than technical specialties.
A team that includes developers, testers, and operations engineers for a specific service naturally develops shared ownership.
Resistance from Operations Teams
Operations engineers sometimes resist DevOps because they fear losing their role or having developers make dangerous changes to production. The framing that helps: DevOps does not eliminate operations expertise---it embeds it throughout the organization.
Operations engineers who understand automation, monitoring, and reliability become more valuable, not less.
Legacy Systems
Applications built before DevOps existed are often difficult to automate. Monolithic architectures with manual deployment processes, undocumented configuration, and no test coverage resist modernization.
The pragmatic approach is strangler fig pattern: build new functionality as separate services using DevOps practices, gradually migrating functionality from the legacy system. Do not attempt a big-bang rewrite; incrementally reduce the legacy system's scope while building modern, well-automated replacements.
Security and Compliance Concerns
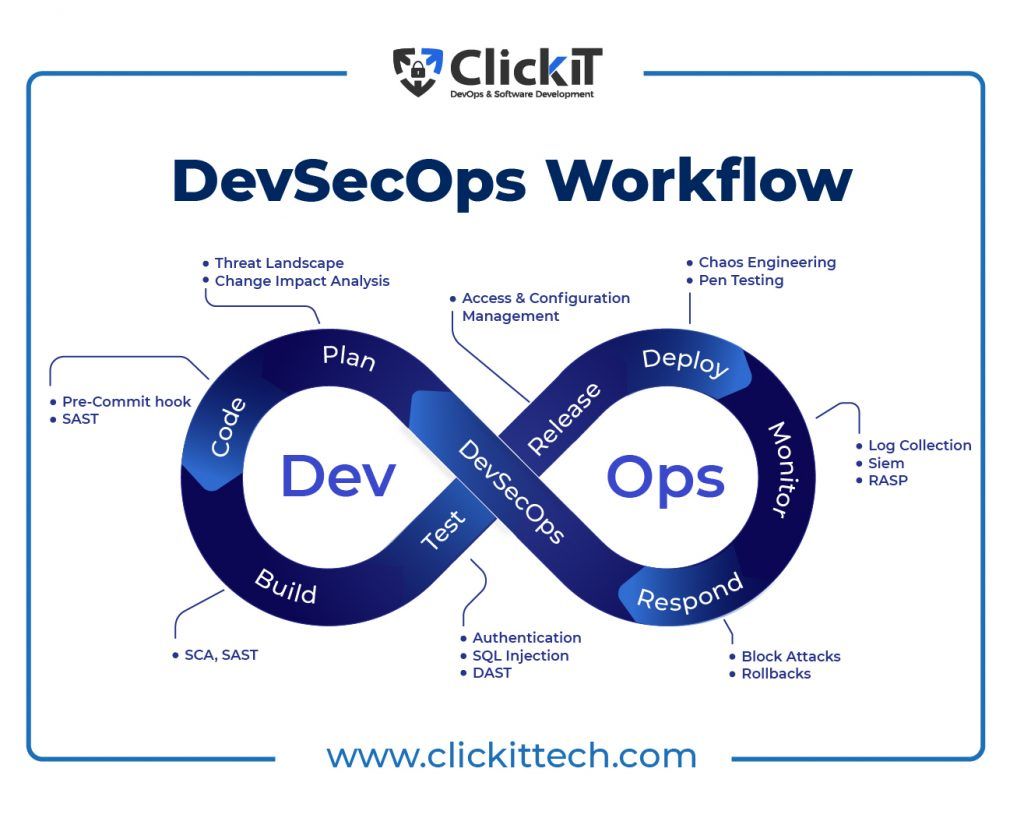
Security teams sometimes view DevOps practices as threatening compliance or creating security risk. The solution is "DevSecOps": embedding security into the DevOps pipeline rather than treating it as an external gate.
Security scanning (SAST, SCA, container scanning) runs automatically in the CI pipeline. Infrastructure as Code is reviewed for security misconfigurations before deployment. Compliance controls are automated rather than manual. This approach increases security rigor while maintaining deployment velocity.
Starting the DevOps Journey
DevOps adoption works best when it is incremental and focused on specific pain points rather than comprehensive organizational transformation.
Starting point assessment: Measure your current DORA metrics. Where does the most time go between "code written" and "code running in production"? Is it manual testing? Waiting for approval? Manual deployment steps? Waiting for infrastructure provisioning? The biggest bottleneck is the highest-leverage starting point.
Typical progression:
Month 1-3: Establish version control discipline, basic automated testing, and a simple CI pipeline that runs tests on every pull request. This alone transforms development quality.
Month 3-6: Implement automated deployment to staging environments. Establish basic monitoring and alerting so the team knows about production problems before users do.
Month 6-12: Implement Infrastructure as Code for new infrastructure. Establish post-mortem practices for incidents. Begin automated production deployments with rollback capability.
Year 2+: Implement advanced deployment strategies (canary, blue-green). Invest in comprehensive observability. Establish chaos engineering practices. Continuously measure DORA metrics and identify the next bottleneck.
Example: Etsy's DevOps transformation is one of the most documented in the industry. In 2009, Etsy deployed monthly with dozens of engineers required for each release. By 2012, they were deploying 50+ times per day with any engineer able to deploy with a single button push.
The transformation took three years of sustained effort, cultural change, and tooling investment. Their engineering blog documented the journey in detail, providing a template that many organizations have followed.
DevOps and Organizational Culture
The technology of DevOps is learnable in months. The culture takes years.
Psychological safety is foundational. Engineers who fear punishment for mistakes hide information, avoid risky changes, and do not honestly report problems. This makes the system more brittle. Engineers who feel safe to report mistakes, raise concerns, and admit uncertainty create better feedback loops and more reliable systems.
Measuring outcomes over activity signals organizational values. Teams measured on number of tickets closed or lines of code written optimize for those metrics, not for customer outcomes. Teams measured on service reliability, user satisfaction, and deployment frequency focus on what actually matters.
Trust as infrastructure: DevOps requires developers to trust operations not to break their code, and operations to trust developers not to destabilize production. This trust is built incrementally through transparency---shared dashboards, open post-mortems, joint incident response---not through policy.
The organizations that have most successfully adopted DevOps share a common trait: they genuinely believe that improving the software delivery system is as important as building the software itself.
They invest engineering time in platforms, automation, and tooling that makes everyone more effective. They treat the deployment pipeline as a product that needs maintenance, improvement, and investment.
This mindset---that the process of building software is worth engineering rigor---is what separates organizations that adopt DevOps practices superficially from those that realize its full potential.
What Research and Industry Reports Show About DevOps Practices
The evidence base for DevOps practices has grown from anecdote to rigorous measurement over the past decade.
Nicole Forsgren, Jez Humble, and Gene Kim's Accelerate (IT Revolution Press, 2018) is the most cited quantitative study of software delivery performance. Drawing on four years of DORA survey data from more than 23,000 respondents, the book identifies specific technical practices that cause measurable performance improvements.
The key finding: high deployment frequency and high stability are positively correlated, not negatively. This directly contradicts the conventional assumption that speed and stability are in tension.
The DORA State of DevOps Report (annual, 2014-present) consistently shows four capabilities most strongly associated with elite performance: use of version control for all production artifacts, comprehensive CI/CD, trunk-based development, and test automation.
Organizations implementing all four are 7.5 times more likely to be elite performers than those without them. The 2023 report found that 21% of surveyed organizations qualify as elite performers, up from 7% in 2017.
The 2023 GitHub "Octoverse" report analyzed data from over 4 million repositories and 100 million developers.
It found that pull request merge time (the interval from PR opening to merge) is the strongest predictor of overall software delivery performance---more predictive than team size, programming language, or organizational structure.
Median PR merge time for high-performing organizations was under four hours; for low performers, over 96 hours.
Puppet Labs' "State of DevOps" report (2016) surveyed 4,600 technical professionals and found that high-performing DevOps organizations spent 50% less time remediating security issues, 22% less time on unplanned work, and had 50% fewer failed change requests.
The financial modeling suggested these organizations had the equivalent of two extra months of productivity per year compared to low performers.
McKinsey's "Developer Velocity" research (2021) surveyed 440 companies and found that companies in the top quartile of developer velocity generated 4-5 times more revenue growth than bottom-quartile peers.
The research identified infrastructure investment (particularly cloud platforms and CI/CD automation) as the highest-leverage intervention, producing 10-20% velocity improvements within 12 months.
Real-World Case Studies: DevOps in Practice
Flickr's Foundational Moment (2009): John Allspaw and Paul Hammond's presentation "10+ Deploys Per Day: Dev and Ops Cooperation at Flickr" at the Velocity Conference in June 2009 is widely credited with launching the DevOps movement.
At the time, Flickr was deploying code to production more than ten times daily while maintaining high availability. Their approach was cultural and organizational rather than technological: developers and operations engineers shared responsibility for production, monitored shared dashboards, and jointly responded to incidents.
The 46-slide presentation demonstrated that deployment frequency and reliability were not in conflict, and introduced the "blame the system, not the person" framing that became central to DevOps culture.
Etsy's Continuous Deployment Transformation (2009-2012): In 2009, Etsy deployed monthly. New deployments required a team of engineers and extensive manual verification. By 2012, Etsy deployed more than 50 times per day, with any engineer able to deploy through a self-service interface called Deployinator.
The transformation, documented extensively in the Etsy engineering blog, took three years and involved cultural changes (blameless post-mortems, shared on-call rotations), technical changes (comprehensive test automation, monitoring), and organizational changes (developers took on-call responsibility for services they built).
Etsy's detailed public documentation of this journey became a template followed by dozens of organizations.
Amazon's Deployment Frequency Growth: Amazon's transition from quarterly releases to thousands of daily deployments took more than a decade.
Werner Vogels, Amazon's CTO, articulated the "you build it, you run it" principle that became the organizational foundation: development teams are responsible for their services through the entire lifecycle including production operations.
The microservices architecture that emerged from this organizational model (each team owns their service's API, database, deployment pipeline, and on-call rotation) enabled independent deployment by each team.
Amazon reported deploying to production at a rate of more than one deployment every second at peak in 2011, scaling to much higher frequencies in subsequent years.
Knight Capital Group's DevOps Failure (2012): On August 1, 2012, Knight Capital Group, then one of the largest US equity market makers, deployed new trading software to production. A manual deployment process left old code active on one of eight servers.
The misconfigured server executed 4 million stock trades in 45 minutes, accumulating a $440 million loss that effectively bankrupted the firm. The SEC's administrative proceeding (File No.
3-15570, 2013) documented the failure: no automated deployment consistency checks, no canary deployment, no automated rollback, and no monitoring that would have caught the discrepancy between server behaviors. Knight Capital was acquired by Getco four months later.
The case is the most frequently cited example of the business cost of inadequate deployment practices.
Google's SRE Practice at Scale: Google's Site Reliability Engineering team, created in 2003 by Ben Treynor Sloss, applies software engineering methods to operations problems.
The team's practices---error budgets, SLOs, blameless post-mortems, chaos engineering, toil measurement---were documented in the Site Reliability Engineering book (Beyer, Jones, Petoff, Murphy; O'Reilly, 2016) and the Site Reliability Workbook (2018).
These books became the most influential operational practice references in the industry.
By 2023, SRE job titles and practices had been adopted at thousands of organizations globally, with Google's frameworks serving as the reference implementation.
Key Metrics and Evidence for DevOps Practices
Deployment frequency benchmarks: The DORA 2023 report found that elite performers deploy on demand (multiple times per day), high performers deploy between once per week and once per month, medium performers deploy between once per month and once every six months, and low performers deploy less than once every six months.
The gap between elite and low performers has grown over successive annual reports as elite performers continue accelerating.
Lead time compression: The DORA research found that elite performers achieve lead time (code committed to code running in production) of less than one hour. Low performers have lead times of one to six months.
The 106x difference in lead time between elite and low performers represents a fundamental competitive advantage in market responsiveness.
Change failure rate and frequency correlation: The most counterintuitive DORA finding: change failure rate decreases as deployment frequency increases. Low performers have change failure rates of 46-60%; elite performers have failure rates of 0-15%.
The explanation is batch size: frequent deployments are small, well-understood, and easy to roll back. Infrequent deployments accumulate risk.
Mean Time to Restore: Elite performers restore service after incidents in less than one hour; low performers take one week to one month. The 2,604x difference compounds across every incident.
An organization that resolves incidents in 30 minutes instead of three weeks preserves vastly more uptime and user trust across a year of operations.
Automation ROI: Puppet's 2016 State of DevOps report found that high-performing organizations spent 44% less time on unplanned work and rework than low performers.
At median engineering compensation, eliminating 44% of unplanned work across a 100-engineer organization represents approximately $6.6 million in annual recovered productive capacity.
Feature Flags and Progressive Delivery: Research and Real-World Outcomes
Feature flags (also called feature toggles) have emerged as one of the highest-leverage DevOps practices for organizations that want to separate deployment from release---shipping code to production without exposing it to users---and the research on their impact is substantial.
Edith Harbaugh and colleagues at LaunchDarkly published "The Feature Flag Maturity Model" (2021), synthesizing survey data from 700 software practitioners on feature flag adoption.
The study found that organizations using feature flags as a standard practice deployed 55 times more frequently than those that did not, and their change failure rates were 50% lower.
The mechanism: feature flags allow incomplete or risky features to be deployed behind a flag, decoupling the deployment risk (code running in production) from the release risk (users experiencing the feature). Deployments can happen continuously; releases happen when the team is ready.
Microsoft's experimentation platform, ExP, has supported controlled experiments (A/B tests) on Azure and Bing since 2008.
Ronny Kohavi, who led Microsoft's experimentation efforts and later those at Airbnb, published "Online Controlled Experiments at Large Scale" (KDD 2013) documenting the organizational discipline required to run statistically valid experiments at scale.
Kohavi's key finding: most product hypotheses are wrong.
Across thousands of experiments run at Microsoft, Bing, and Airbnb, approximately two-thirds of proposed changes failed to produce statistically significant improvements. Feature flags that route only a percentage of traffic to new features provide the infrastructure for this experimentation discipline.
Facebook's engineering team (Featherstone et al.) documented their "Gatekeeper" feature flag system in a 2017 engineering blog post. Gatekeeper manages thousands of concurrent feature flags across Facebook's codebase, allowing gradual rollouts from 0.1% of users to 1% to 10% to full release.
The system integrates with Facebook's deployment pipeline to automatically halt rollouts when error rates or user engagement metrics degrade below thresholds.
The practical result: Facebook can ship features to production multiple times per day with rollouts controlled programmatically, not through deployment risk management.
Flagsmith's 2023 "State of Feature Flags" survey (n=2,500 software teams) found that 78% of organizations with more than 100 engineers used feature flags as a standard deployment practice, up from 42% in 2018.
The survey found the highest adoption in fintech (89%) and e-commerce (85%), sectors where the ability to test features on a subset of users while managing risk for the full customer base is commercially critical.
Netflix's content testing infrastructure uses feature flags extensively: different recommendation algorithm variants are tested simultaneously on different user segments, with the experimentation platform routing traffic based on user cohorts defined by viewing history and geographic location.
DevSecOps: Integrating Security into the DevOps Pipeline
The integration of security practices into DevOps workflows---often called DevSecOps or "shifting security left"---has moved from a niche concept to an industry-standard expectation over the 2018-2024 period, driven by regulatory pressure, high-profile supply chain attacks, and the economics of finding vulnerabilities early.
Gartner analyst Neil MacDonald coined the term "DevSecOps" in a 2012 research note describing the need to embed security practices throughout the software development lifecycle rather than treating security as a final gate.
The concept gained urgency following the SolarWinds attack (December 2020), in which attackers compromised the build pipeline of SolarWinds' Orion product, injecting malicious code that was compiled, signed, and distributed to 18,000 customers as a legitimate software update.
The attack, attributed to Russian state actors by the US government, persisted undetected for nine months. The NSA, CISA, and ODNI issued a joint advisory in January 2021 explicitly citing CI/CD pipeline security as a national security concern.
Sonatype's "State of the Software Supply Chain" report (2023, analyzing 500 billion open-source downloads) found that supply chain attacks---malicious code injected into open-source dependencies---increased 742% from 2019 to 2022.
The average time between a vulnerability being publicly disclosed and being exploited was 24 hours. Organizations with automated Software Composition Analysis (SCA) in their CI pipelines identified and remediated 85% of dependency vulnerabilities before they reached production; organizations relying on manual reviews remediated 23%.
The 3.7x difference in vulnerability remediation rate represents the direct quantified benefit of pipeline-integrated security scanning.
Veracode's "State of Software Security" report (2023, analyzing 1.5 million application scans across 1,500 organizations) found that applications scanned for security issues through CI pipeline integration showed 69% lower defect density than those scanned manually.
The mechanism is frequency: automated scanning runs on every commit, finding vulnerabilities when they are introduced. Manual scans typically happen quarterly or before releases, by which time vulnerabilities have been built upon and are expensive to remove.
The report found that the average time to remediate a critical vulnerability discovered in CI was 18 days, compared to 183 days for vulnerabilities discovered in production---a 10x difference in remediation speed.
The Google-developed SLSA (Supply chain Levels for Software Artifacts) framework, released in 2021, established four maturity levels for CI/CD supply chain security: SLSA 1 (documented build process) through SLSA 4 (hermetically isolated builds with cryptographic provenance attestation).
By 2024, SLSA had been adopted as the reference framework by the Linux Foundation, CNCF, and the US government's Securing Open Source Software Act.
Organizations achieving SLSA 3 or higher demonstrate that every artifact can be traced back to specific source code through a verifiable, tamper-resistant chain---directly addressing the attack pattern that made SolarWinds possible.
Sources & Further Reading
- Kim, Gene, Humble, Jez, Debois, Patrick, and Willis, John. The DevOps Handbook: How to Create World-Class Agility, Reliability, and Security in Technology Organizations. IT Revolution Press, 2016.
- Forsgren, Nicole, Humble, Jez, and Kim, Gene. Accelerate: The Science of Lean Software and DevOps. IT Revolution Press, 2018.
- Kim, Gene, Behr, Kevin, and Spafford, George. The Phoenix Project: A Novel about IT, DevOps, and Helping Your Business Win. IT Revolution Press, 2013.
- Allspaw, John and Hammond, Paul. "10+ Deploys Per Day: Dev and Ops Cooperation at Flickr." Velocity Conference, 2009. View source
- Google. "DORA State of DevOps Report." dora.dev, 2023. View source
- Beyer, Betsy, Jones, Chris, Petoff, Jennifer, and Murphy, Niall Richard. Site Reliability Engineering: How Google Runs Production Systems. O'Reilly Media, 2016. View source
- Humble, Jez and Farley, David. Continuous Delivery: Reliable Software Releases through Build, Test, and Deployment Automation. Addison-Wesley, 2010.
- Liker, Jeffrey. The Toyota Way: 14 Management Principles from the World's Greatest Manufacturer. McGraw-Hill, 2004.
- Dekker, Sidney. The Field Guide to Understanding Human Error, 3rd ed. CRC Press, 2014.
- CNCF. "CNCF Cloud Native Interactive Landscape." landscape.cncf.io. View source
Frequently Asked Questions
What is DevOps and why does it matter?
DevOps is a set of practices and culture that breaks down traditional separation between development (writing code) and operations (running systems). Instead of developers ‘throwing code over the wall’ to operations, teams work together throughout the entire software lifecycle, building, testing, deploying, and monitoring. Key practices include automation, continuous integration/deployment, infrastructure as code, and shared responsibility. The goal: ship software faster, more reliably, with fewer failures. Companies practicing DevOps effectively can deploy multiple times per day instead of quarterly.
What are the core principles that define DevOps culture?
Core principles include: collaboration and shared responsibility between dev and ops, automation of repetitive tasks (testing, deployment, infrastructure), continuous integration and delivery of small changes, fast feedback loops at every stage, treating infrastructure as code (version-controlled, reproducible), monitoring and observability to detect issues quickly, learning from failures rather than blaming, and incremental improvement rather than perfection. It’s fundamentally about culture and practices, not just tools, though tools enable the practices.
What is continuous integration and continuous deployment (CI/CD)?
Continuous Integration (CI) means developers merge code changes into a shared repository frequently (multiple times per day), with automated tests running on every commit to catch problems early. Continuous Deployment (CD) automatically deploys code that passes tests to production, without manual approval. Together, CI/CD creates a pipeline: code → automated tests → staging → production, all automated. This enables rapid iteration, reduces integration problems, and gives confidence to deploy frequently. Most teams start with CI, then gradually add CD as confidence and automation improve.
What does 'infrastructure as code' mean in DevOps?
Infrastructure as Code (IaC) treats server configurations, networks, and infrastructure like software code. Instead of manually clicking through cloud consoles or SSH-ing to configure servers, you write configuration files (code) describing desired infrastructure state. Tools like Terraform, CloudFormation, or Ansible read these files and create/update infrastructure automatically. Benefits: version control for infrastructure, reproducible environments (dev matches production), faster provisioning, documentation embedded in code, and ability to destroy and recreate environments easily. Infrastructure becomes reliable and repeatable.
How do DevOps practices improve software quality and reliability?
Quality improvements come from: automated testing catching bugs before production, small frequent changes that are easier to test and debug, fast feedback revealing problems immediately, monitoring that detects issues in production quickly, ability to roll back problematic changes rapidly, infrastructure consistency reducing environment-related bugs, shared responsibility making everyone care about production stability, and post-incident reviews that improve processes. Paradoxically, deploying more frequently (but in small, tested increments) often reduces failures compared to large, infrequent releases.
What are common obstacles when adopting DevOps practices?
Common obstacles include: organizational silos and resistance to collaboration, legacy systems not designed for automation, lack of automation skills in the team, fear of change and losing control, tool overload and complexity, existing processes that contradict DevOps principles, insufficient executive support, attempting too much change at once, focusing on tools without culture change, and measuring the wrong metrics (activity instead of outcomes). Successful adoption requires cultural change, not just technical changes, and happens incrementally, not overnight.
What tools are commonly used in DevOps, and do you need all of them?
Common tool categories: version control (Git), CI/CD platforms (Jenkins, GitHub Actions, GitLab CI), infrastructure as code (Terraform, Ansible), containerization (Docker, Kubernetes), monitoring (Prometheus, Datadog), logging (ELK stack, Splunk), and cloud platforms (AWS, Azure, GCP). You don’t need all tools, start with version control and basic CI/CD, add others as needs emerge. Tool selection depends on your tech stack, team size, and cloud provider. Focus on practices and culture first; tools enable practices but don’t create them.