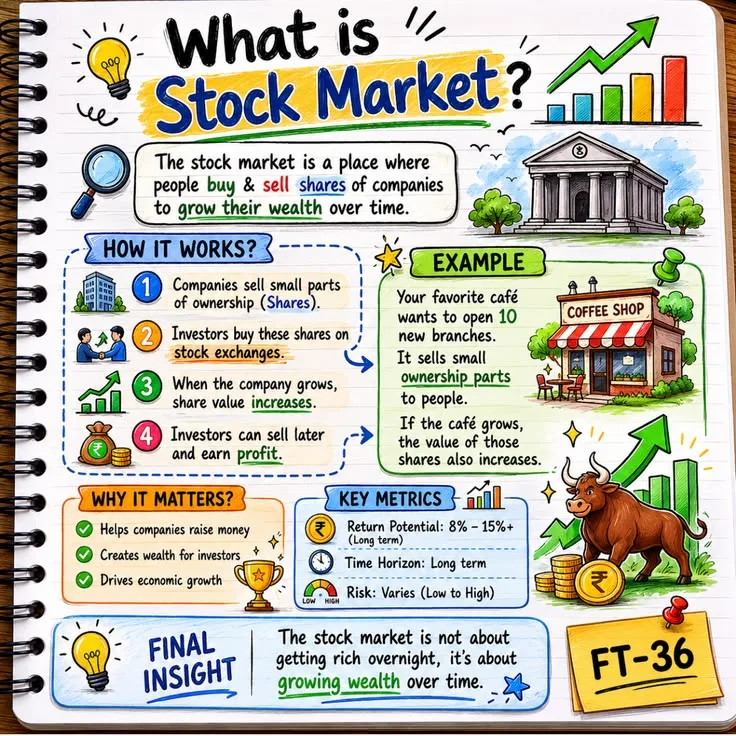
The stock market works by connecting buyers and sellers of company shares through regulated exchanges, where prices change continuously based on supply and demand. When you buy a stock, you are purchasing a small ownership stake in a business.
When more investors want to own that stake than want to sell it, the price rises. When sellers outnumber buyers, it falls. At its core, the stock market is a price-discovery mechanism, a giant, real-time auction that attempts to reflect what millions of people collectively believe a business is worth.
Understanding how this system functions matters well beyond Wall Street. The performance of equity markets affects retirement accounts, pension funds, corporate investment decisions, and economic confidence.
Whether you plan to invest or simply want to understand the financial news, knowing how the machinery of markets operates gives you a significant advantage over those who see only prices moving without reason.
This article explains the full chain: how exchanges are structured, who the participants are, what moves prices, how indices are constructed, and what a beginner should know before placing a first trade.
"The stock market is a device for transferring money from the impatient to the patient.", Warren Buffett
Key Definitions
Share (stock): A unit of ownership in a company. Owning shares entitles you to a proportional claim on the company's assets and, if declared, dividends.
Exchange: A regulated marketplace where securities are bought and sold. Major examples include the New York Stock Exchange (NYSE) and the Nasdaq.
Market maker: A financial firm that continuously quotes both a buy price (bid) and a sell price (ask) for a security, providing liquidity so that other participants can always trade.
Bid-ask spread: The difference between the highest price a buyer is willing to pay (bid) and the lowest price a seller will accept (ask). This spread is the primary cost of trading for most retail investors.
Index: A statistical composite that tracks the performance of a selected group of stocks. The S&P 500, for example, tracks 500 large US companies and is weighted by market capitalization.
Equity: Another word for stock or share, ownership interest in a company. Public equities trade on exchanges; private equity refers to ownership stakes in companies that have not listed publicly.
Market capitalization: The total market value of a company's outstanding shares, calculated by multiplying the share price by the number of shares outstanding. A company with 100 million shares at $50 each has a market cap of $5 billion.
Dividend: A cash payment distributed by a company to its shareholders, typically from profits. Not all companies pay dividends; growth-oriented companies often reinvest profits rather than distribute them.
P/E ratio (price-to-earnings): A valuation metric comparing a company's share price to its annual earnings per share. A P/E of 20 means investors are paying $20 for every $1 of annual earnings. High P/E ratios indicate that investors expect strong future growth; low ratios may indicate undervaluation or slow growth expectations.
Major US Stock Indices: Comparison
| Index | Companies Tracked | Weighting Method | Focus | Best Used For |
|---|---|---|---|---|
| S&P 500 | 500 large US companies | Market-cap weighted | Broad large-cap US market | General US equity benchmark |
| Dow Jones Industrial Average (DJIA) | 30 large US companies | Price weighted | Blue-chip US companies | Historical reference; less representative |
| Nasdaq Composite | ~3,000+ Nasdaq-listed | Market-cap weighted | Technology-heavy | Tech sector performance |
| Russell 2000 | 2,000 smaller US companies | Market-cap weighted | Small-cap US market | Small-cap exposure benchmark |
| Total Market (e.g., VTI) | ~4,000 US companies | Market-cap weighted | Entire US public equity market | Broadest US diversification |
The S&P 500 is the most widely used benchmark because it covers ~80% of US market capitalization and is maintained by a transparent selection committee.
How Exchanges Work
The Role of Stock Exchanges
A stock exchange is not a physical marketplace in the traditional sense, it is primarily a set of rules, systems, and technology that match buy and sell orders. The NYSE still maintains a famous trading floor in Manhattan, but the vast majority of matching now happens electronically.
Nasdaq has never had a physical floor; it was the world's first electronic stock exchange when it launched in 1971.
Companies list their shares on an exchange through an Initial Public Offering (IPO). The IPO is managed by investment banks that underwrite the offering, help set an initial price, and distribute shares to institutional investors before the stock starts trading publicly.
Once listed, the company's shares trade freely on the secondary market, meaning investors buy and sell among themselves, with the company receiving no proceeds from those transactions.
The IPO process has been supplemented in recent years by alternative listing paths. Direct listings (used by Spotify in 2018 and Palantir in 2020) allow companies to list existing shares without underwriters or new share creation, saving substantial fees.
Special Purpose Acquisition Companies (SPACs), shell companies that raise capital through IPOs and then merge with private firms, surged in popularity in 2020-2021 before falling out of favor as many SPAC targets underperformed.
Order Types and Matching
When you place a trade through a brokerage, your order enters the exchange's order book. A limit order specifies the maximum price you will pay (or minimum you will accept). A market order executes immediately at whatever the current best price is.
The exchange's matching engine pairs buyers and sellers: if your buy limit order matches a sell limit order at the same price, the trade executes.
Price priority and time priority govern the queue. If two buy orders are at the same price, the one placed earlier gets priority. This system ensures fair, orderly execution.
A stop-loss order automatically sells a stock if it falls below a specified price, limiting downside exposure. A trailing stop adjusts the trigger price upward as the stock rises, locking in gains while protecting against reversals.
These order types give investors control over execution without requiring them to monitor prices continuously.
Trading Hours and After-Hours Markets
The major US exchanges operate during regular trading hours from 9:30 AM to 4:00 PM Eastern Time, Monday through Friday (excluding public holidays). However, pre-market trading begins as early as 4:00 AM and after-hours trading extends to 8:00 PM.
These extended sessions allow investors to react to earnings releases and major news that drops outside regular hours.
Liquidity in extended sessions is substantially lower. Wide bid-ask spreads and thin order books make large trades expensive and market orders risky. Retail investors should generally be cautious about trading in after-hours sessions except with limit orders.
Market Makers and Liquidity
Who Are Market Makers?
Market makers are firms, typically large financial institutions or specialist trading companies, that are obligated to continuously quote both sides of a market for certain securities. They buy at the bid price and sell at the ask price, profiting from the spread between the two.
In exchange for this service, they provide liquidity: you can buy or sell almost any major stock instantly rather than waiting for a matching counterparty.
Citadel Securities, Virtu Financial, and Susquehanna International Group are among the largest market makers in US equities. They use sophisticated algorithms to manage their inventory and hedge risk, processing millions of trades daily.
The Bid-Ask Spread
For a stock trading at $100, a market maker might quote a bid of $99.97 and an ask of $100.03. That $0.06 spread is the market maker's gross margin per share. For highly liquid large-cap stocks, spreads are tiny, often just a penny or two.
For thinly traded small-cap stocks or securities on less active exchanges, spreads can be substantial, adding meaningfully to trading costs.
For a buy-and-hold investor making infrequent trades, the spread matters little. For frequent traders, it is a significant drag on returns.
Payment for Order Flow
A practice worth understanding is payment for order flow (PFOF): retail brokerages route customer orders to specific market makers in exchange for payments from those market makers. Robinhood, for example, earned over $800 million from PFOF in 2021.
Critics argue this creates a conflict of interest, brokerages may route to the highest-paying market maker rather than the one giving customers the best execution price. The SEC has debated PFOF regulation for years; European regulators have banned it in most contexts.
The key point for retail investors: "commission-free" trading is not truly free. The cost is embedded in slightly less favorable execution prices. For small, infrequent trades in large liquid stocks, this cost is trivial. For large or frequent trades, it can accumulate.
How Stock Prices Move
Supply and Demand
At the most fundamental level, prices move when the balance between buyers and sellers shifts. A company announcing better-than-expected earnings creates a surge of buyers, pushing the price up until it reaches a level where sellers are again willing to transact.
Disappointing news, rising costs, or a competitor gaining market share can produce the opposite effect.
This process happens continuously during trading hours. On a given day, a single large institutional sell order can push a stock down 2-3% if there are not enough ready buyers at the current price.
Fundamental Factors
Academic finance, particularly work associated with Benjamin Graham and later developed by researchers including Eugene Fama and Robert Shiller, distinguishes between a stock's intrinsic value (based on the present value of future cash flows) and its market price.
In the long run, prices tend to move toward intrinsic value. In the short run, sentiment, momentum, and market narratives can push prices well above or below fundamental worth.
Key fundamental drivers include:
- Earnings per share (EPS) and whether results beat or miss analyst expectations
- Revenue growth and the trajectory of the business
- Interest rates, rising rates reduce the present value of future earnings, making stocks less attractive relative to bonds
- Macroeconomic conditions, GDP growth, unemployment, and consumer confidence all affect corporate profits
One of the most powerful framework for stock valuation is the discounted cash flow (DCF) model: the value of a stock equals the sum of all its future free cash flows, discounted back to the present at an appropriate rate.
When interest rates rise, the discount rate rises, and the present value of future cash flows falls, which is why rate hikes by the Federal Reserve tend to push stock prices lower, particularly for high-growth companies whose value is concentrated in distant future profits.
The Efficient Market Hypothesis
Eugene Fama received the Nobel Memorial Prize in Economic Sciences in 2013 (jointly with Robert Shiller and Lars Peter Hansen) for his work on the Efficient Market Hypothesis (EMH).
In its strong form, the EMH holds that stock prices already reflect all available information, public and private, making it impossible to consistently outperform the market through analysis or trading.
The weak form holds that prices reflect all historical price information (technical analysis cannot beat the market). The semi-strong form holds that prices reflect all public information (fundamental analysis cannot consistently beat the market either). The strong form holds that even insider information is reflected in prices.
The practical implication: if markets are efficient, the best strategy is to hold broadly diversified low-cost index funds rather than trying to identify underpriced stocks. Empirical evidence, particularly long-term SPIVA data, strongly supports this conclusion for most investors.
Behavioral Factors
Robert Shiller's Nobel Prize-winning work demonstrated that stock market volatility far exceeds what can be explained by changes in dividends or earnings alone. Investor psychology plays a major role. Fear of missing out drives prices up in bull markets; panic accelerates declines in bear markets.
The tendency of investors to anchor on recent price levels, to follow the crowd, and to overreact to news creates patterns that fundamental analysis cannot always predict.
Behavioral finance, the study of how psychological biases affect financial decisions, identifies several systematic errors investors make:
- Loss aversion: The pain of a $1,000 loss is psychologically roughly twice as powerful as the pleasure of a $1,000 gain (Kahneman and Tversky, 1979). This causes investors to sell winners too early and hold losers too long.
- Recency bias: Recent events disproportionately influence expectations. After a bull market, investors become overconfident; after a crash, they underestimate recovery potential.
- Herding: Following the crowd into popular investments, which tends to produce bubbles at peaks and capitulation at troughs.
- Overconfidence: Individual investors consistently overestimate their ability to pick winning stocks. Studies show the more actively individuals trade, the worse their returns relative to a buy-and-hold strategy.
Bull Markets and Bear Markets
Defining Bull and Bear
A bull market is conventionally defined as a rise of 20% or more from a recent trough, sustained over an extended period. A bear market is a decline of 20% or more from a recent peak. These thresholds are arbitrary, markets do not pause at round numbers, but they provide a useful framework for discussing broad market regimes.
Since World War II, the US has experienced roughly 13 bear markets. The average bear market has lasted about 11 months and produced an average loss of around 35%. The average bull market has lasted over 4 years and produced gains of over 150%.
This asymmetry is central to the case for long-term equity investing: time in the market matters more than timing the market.
Historical Bull and Bear Markets: Selected Major Episodes
| Period | Type | Duration | S&P 500 Change | Primary Cause |
|---|---|---|---|---|
| 1929-1932 | Bear | ~3 years | -86% | Great Depression, bank failures |
| 1949-1968 | Bull | ~19 years | +936% | Post-WWII economic expansion |
| 1973-1974 | Bear | ~21 months | -48% | Oil embargo, stagflation |
| 1982-2000 | Bull | ~18 years | +1,700%+ | Technology revolution, disinflation |
| 2000-2002 | Bear | ~2.5 years | -49% | Dot-com bubble collapse |
| 2007-2009 | Bear | ~17 months | -57% | Housing crisis, financial contagion |
| 2009-2020 | Bull | ~11 years | +400%+ | Monetary stimulus, tech dominance |
| 2020 (COVID) | Bear | ~33 days | -34% | Pandemic shock (shortest bear market ever) |
| 2022 | Bear | ~9 months | -25% | Rate hikes, inflation |
Causes of Bull and Bear Markets
Bull markets typically coincide with strong economic growth, low or falling interest rates, rising corporate profits, and high investor confidence. The longest bull market in US history ran from March 2009 to February 2020, a period of extraordinary monetary stimulus following the financial crisis.
Bear markets are triggered by recessions, rising interest rates, financial crises, geopolitical shocks, or the bursting of asset price bubbles. The 2000-2002 bear market followed the collapse of the dot-com bubble. The 2008-2009 bear market was driven by the housing crisis and subsequent financial system stress.
"Bull markets are born on pessimism, grown on skepticism, mature on optimism, and die on euphoria.", Sir John Templeton
Stock Market Indices
How Indices Are Constructed
An index is not a tradeable security itself; it is a formula that calculates a composite value from the prices of its constituent stocks.
The S&P 500, maintained by S&P Dow Jones Indices, tracks 500 large US companies selected by a committee based on market capitalization, liquidity, and financial viability. It is market-cap weighted, meaning larger companies have more influence on the index level.
The Dow Jones Industrial Average (DJIA), by contrast, is price-weighted: a stock with a higher share price has greater influence regardless of the company's actual size. This is an artifact of its 19th-century origins and makes it a less accurate reflection of the overall market.
Created by Charles Dow in 1896 with just 12 industrials, the DJIA is today more a historical relic than a meaningful benchmark, yet it remains the most widely cited market indicator in news media.
The Nasdaq Composite tracks all stocks listed on Nasdaq, over 3,000 companies, with a heavy weighting toward technology. The Russell 2000 tracks 2,000 smaller US companies and is often used as a benchmark for small-cap performance.
Why Indices Matter for Investors
Index funds and ETFs (Exchange-Traded Funds) that track these indices have become the dominant investment vehicle for long-term investors. A single S&P 500 index fund gives a retail investor exposure to 500 major US companies at annual costs often below 0.05%.
This low-cost diversification is why index investing has grown dramatically since John Bogle launched the first retail index fund at Vanguard in 1976.
As of 2023, passive index funds held more US equity assets than actively managed funds for the first time, a milestone that would have been unthinkable when Bogle launched Vanguard's first index fund and competitors derisively called it "Bogle's folly." The shift to passive investing has fundamental implications for market efficiency, corporate governance, and the economics of the asset management industry.
Institutional vs. Retail Investors
Who Moves the Market?
Institutional investors, pension funds, mutual funds, insurance companies, sovereign wealth funds, and hedge funds, control the vast majority of assets in the market. BlackRock, Vanguard, and State Street together hold stakes in virtually every major US public company.
When large institutions rebalance portfolios, their trades can move markets meaningfully.
Retail investors, individuals trading through brokerage accounts, have grown significantly as a force in markets since the emergence of commission-free trading apps.
The GameStop short squeeze of January 2021, coordinated through the WallStreetBets community on Reddit, demonstrated that coordinated retail activity could overwhelm institutional short positions in specific stocks. However, for the broad market, institutional activity dominates volume.
The Rise of High-Frequency Trading
High-frequency trading (HFT) firms use sophisticated algorithms, co-located servers, and ultra-fast network connections to execute thousands of trades per second, exploiting minute price discrepancies across exchanges. HFT now accounts for roughly 50% of US equity trading volume.
Critics argue HFT front-runs institutional orders and adds to volatility; proponents argue it tightens bid-ask spreads and improves liquidity for all participants.
The empirical evidence suggests HFT has on balance narrowed spreads and reduced transaction costs for most investors, even as it has created occasional flash crashes, the May 2010 Flash Crash saw the Dow Jones drop nearly 1,000 points intraday before recovering within minutes, triggered by algorithmic cascades.
Information Asymmetry
Institutional investors have significant advantages: research teams, access to company management through investor days, sophisticated data tools, and lower transaction costs. Retail investors, however, are no longer completely at a disadvantage.
The SEC's Regulation FD (Fair Disclosure), introduced in 2000, requires companies to disclose material information publicly, preventing selective disclosure to favored institutions.
The rise of free financial data, earnings call transcripts, and investor relations portals has substantially narrowed the information gap between institutions and retail investors for publicly available information. The remaining institutional edge lies primarily in data processing capacity and speed of analysis.
Short Selling and Other Advanced Mechanisms
How Short Selling Works
Short selling is a technique that allows investors to profit from falling stock prices. A short seller borrows shares from a broker, sells them immediately, and hopes to buy them back at a lower price later, returning the borrowed shares and pocketing the difference.
If the stock rises instead, the short seller faces losses that are theoretically unlimited (a stock can rise indefinitely, but it can only fall to zero).
Short selling serves an important function in markets: it allows investors who believe a stock is overvalued or a company is engaged in fraud to act on that belief, which accelerates price correction toward fundamental value.
Famous short sellers, including those who identified Enron's accounting irregularities in 2001 and Wirecard's fraud in Europe in 2019, have uncovered corporate misconduct that regulators missed.
The GameStop short squeeze of January 2021 highlighted the risks short sellers face.
Melvin Capital, which had a large short position in GameStop, lost approximately 53% of its value in January 2021 alone as retail investors coordinated buying to push the stock from around $20 to a peak of $483, forcing short sellers to buy back shares at enormous losses.
Options and Derivatives
Options are contracts giving the buyer the right (but not the obligation) to buy or sell a stock at a specified price before a specified date. A call option gives the right to buy; a put option gives the right to sell.
Options have legitimate uses, hedging portfolio risk, generating income through covered calls, expressing nuanced market views. But they are complex instruments with time decay, volatility sensitivity, and leverage that makes them disproportionately risky for inexperienced investors.
The Options Clearing Corporation processed over 10 billion options contracts in 2023, reflecting their widespread use by both institutions and increasingly active retail traders.
How to Start Investing: A Practical Framework
Step 1: Open a Brokerage Account
Reputable brokerages offering commission-free trading include Fidelity, Schwab, and Vanguard in the US. Each allows you to open a standard taxable account or a tax-advantaged account such as an IRA (Individual Retirement Account). Tax-advantaged accounts offer significant compounding benefits for long-term investors.
Step 2: Build a Core Portfolio with Index Funds
Before buying individual stocks, most financial researchers, including work from SPIVA (S&P Indices Versus Active), which compares active fund managers to their benchmark indices, recommend a foundation of low-cost index funds.
SPIVA data consistently shows that approximately 92% of actively managed large-cap US funds underperformed the S&P 500 over the 15-year period ending in 2023, after fees.
A simple three-fund portfolio, a US total market index fund, an international index fund, and a bond index fund, provides broad diversification at minimal cost. The simplicity of this approach is not a weakness: decades of data support it as superior to most attempts at sophisticated stock selection.
Step 3: Invest Consistently and Resist Market Timing
Dollar-cost averaging, investing a fixed amount at regular intervals regardless of market conditions, reduces the risk of buying a large position at a market peak. Research from Vanguard and other institutions shows that most investors who attempt to time the market underperform those who simply invest consistently.
A Dalbar study covering 30 years of market data found that the average equity investor earned significantly less than the S&P 500, not because they chose bad funds, but because they bought and sold at the wrong times, reducing returns through poor timing decisions.
The market returned approximately 9.9% annually from 1993 to 2022; the average investor in equity funds earned approximately 6.4% annually due to poor timing.
Step 4: Understand Risk Tolerance
Before investing any amount, assess your time horizon and risk tolerance. Money needed within 2-3 years should not be in equities. Historically, the US stock market has never produced a negative return over any 20-year period, but it has produced devastating short-term losses.
The 2008-2009 bear market saw the S&P 500 fall nearly 57% from peak to trough.
The Power of Compounding Over Time
A $10,000 investment in an S&P 500 index fund in 1990 would have grown to approximately $200,000 by 2025, assuming reinvested dividends. This is not a guarantee of future results, but it illustrates why long-term equity investing has historically been one of the most powerful wealth-building tools available to ordinary individuals.
Albert Einstein allegedly called compound interest the "eighth wonder of the world", whether or not he said it, the math is unambiguous. At a 10% annual return, $10,000 doubles roughly every 7 years: $20,000 at year 7, $40,000 at year 14, $80,000 at year 21, $160,000 at year 28.
The gains compound on the gains. Starting early matters enormously: a 25-year-old who invests $5,000 per year will have substantially more at 65 than a 35-year-old who invests the same total amount over fewer years, simply because of 10 additional years of compounding.
Understanding Corporate Events That Move Stocks
Earnings Seasons
Every quarter, publicly traded companies report their financial results in earnings releases. The market's reaction is not primarily to whether earnings were good or bad in absolute terms, but to whether they were better or worse than analyst consensus estimates.
A company reporting 20% profit growth but slightly below analyst expectations can see its stock fall. A company reporting a small loss but beating expectations can see its stock rise.
Earnings seasons, the periods after each fiscal quarter when the bulk of companies report, create concentrated periods of stock-specific volatility. Many professional traders reduce position sizes before major earnings releases to avoid being wrong on direction.
Stock Splits and Buybacks
A stock split divides existing shares into multiple new ones, reducing the price per share while increasing the number of shares proportionally. A 2-for-1 split gives each shareholder two shares at half the price for every one they held.
Splits do not change a company's fundamental value but can improve liquidity by reducing the per-share price, which makes the stock more accessible to smaller investors. Apple executed a 4-for-1 split in 2020; Amazon a 20-for-1 split in 2022.
Share buybacks (repurchases) occur when companies use cash to purchase their own shares, reducing the number of shares outstanding. With fewer shares, each remaining share represents a larger ownership stake, increasing earnings per share. US companies repurchased a record $922 billion in shares in 2022.
Buybacks can signal management confidence, but critics argue they sometimes represent capital allocation of last resort when companies lack better investment opportunities.
Practical Takeaways
Keep costs low. The single most controllable factor in long-term investment returns is expense ratios. A difference of 1% per year in fees compounds into a massive difference in wealth over 30 years. At 7% annual return, $100,000 grows to $761,000 over 30 years.
At 6% (one percentage point lower due to fees), it grows to $574,000. That 1% fee difference costs $187,000 over 30 years.
Diversify broadly. Owning individual stocks concentrates risk. Index funds spread that risk across hundreds or thousands of companies. Research consistently shows that even expert stock-pickers rarely outperform diversified index portfolios over extended periods.
Stay invested. Studies by Dalbar and others show that the average equity investor significantly underperforms the market due to buying high and selling low during volatility. The ten best days in the US stock market in any given decade account for a disproportionate share of total returns, and those days are nearly impossible to predict.
Understand what you own. If you invest in individual companies, read annual reports (Form 10-K), understand the business model, and assess the valuation relative to peers and historical norms.
Use tax-advantaged accounts. Roth IRAs, traditional IRAs, and 401(k)s offer substantial tax benefits that compound significantly over time. A Roth IRA allows after-tax contributions to grow and be withdrawn completely tax-free, making it one of the most powerful wealth-building vehicles available to US investors.
Sources & Further Reading
- Fama, E. F. (1970). Efficient Capital Markets: A Review of Empirical Work. Journal of Finance, 25(2), 383-417.
- Shiller, R. J. (1981). Do Stock Prices Move Too Much to Be Justified by Subsequent Changes in Dividends? American Economic Review, 71(3), 421-436.
- Graham, B., & Dodd, D. (1934). Security Analysis. McGraw-Hill.
- Bogle, J. C. (2007). The Little Book of Common Sense Investing. Wiley.
- Malkiel, B. G. (1973). A Random Walk Down Wall Street. W. W. Norton.
- SPIVA US Scorecard. (2024). S&P Dow Jones Indices. View source
- Dalbar Quantitative Analysis of Investor Behavior. (2023). Dalbar Inc.
- Vanguard Research. (2022). Dollar-Cost Averaging: Just Following the Rules. Vanguard Group.
- NYSE Group. (2023). US Equity Market Structure Overview. New York Stock Exchange.
- Securities and Exchange Commission. (2000). Regulation FD (Fair Disclosure). 17 CFR Parts 240 and 243.
- Nasdaq. (2023). How the Nasdaq Market Works. Nasdaq OMX Group.
- Zweig, J. (2007). Your Money and Your Brain. Simon & Schuster.
- Kahneman, D., & Tversky, A. (1979). Prospect Theory: An Analysis of Decision under Risk. Econometrica, 47(2), 263-291.
- Thaler, R. H., & Sunstein, C. R. (2008). Nudge: Improving Decisions About Health, Wealth, and Happiness. Yale University Press.
- Angel, J. J., Harris, L. E., & Spatt, C. S. (2011). Equity Trading in the 21st Century. Quarterly Journal of Finance, 1(1), 1-53.
- Options Clearing Corporation. (2024). Annual Market Statistics 2023. OCC.
Frequently Asked Questions
What is the stock market and how does it work?
A regulated network of exchanges where buyers and sellers trade ownership shares of public companies, with prices changing continuously based on supply and demand. Market makers continuously quote buy and sell prices to ensure you can always trade, and indices like the S&P 500 track the average performance of groups of stocks.
How do stock prices go up and down?
Prices move when the balance of buyers and sellers shifts. Positive earnings, strong economic data, or falling interest rates attract buyers and push prices up. Bad news, rising rates, or weak profits push them down. In the short term, investor sentiment and momentum often drive prices away from underlying fundamental value.
What is the difference between a bull market and a bear market?
A bull market is a rise of 20% or more from a recent low; a bear market is a decline of 20% or more from a recent peak. Since WWII, the average bull market has lasted about 4 years; the average bear market about 11 months, which is why long-term investors stay invested through downturns.
What is the difference between institutional and retail investors?
Institutional investors (pension funds, hedge funds, mutual funds) dominate total market volume and have research teams and lower costs. Retail investors trade through individual brokerage accounts and now make up a meaningful share of daily volume, but institutional activity still drives most large price movements.
How can a beginner start investing in the stock market?
Open a low-cost brokerage account, then build around diversified index funds tracking the S&P 500 or total market, SPIVA data shows most active managers underperform their benchmark over 10+ years. Invest consistently, reinvest dividends, and never put money you need within 2-3 years into equities.