Startup failure rate refers to the percentage of new businesses or venture-backed companies that cease operations within a given timeframe.
The widely repeated claim that "90% of startups fail" is a distortion of more nuanced data: Bureau of Labor Statistics research shows approximately 20% of new businesses close in their first year, 45% by year five, and 65% by year ten.
The higher figures apply only to the narrow subset of venture-capital-funded technology companies measured against investor return thresholds, not to all new businesses.
Somewhere in the mid-2000s, a statistic entered startup culture and never left: "90% of startups fail." It appears in pitch decks, in entrepreneurship textbooks, in TED Talks, and in the opening paragraphs of countless articles about risk-taking.
There is only one significant problem with it: the number does not appear to be true, the term "startup" is rarely defined, and the term "fail" is used interchangeably with "close," "pivot," "get acquired," and "not achieve VC-scale returns."
The actual data on new business survival - drawn from the Bureau of Labor Statistics' longitudinal employer data, the most comprehensive and methodologically rigorous source available - tells a different and more nuanced story.
These are genuine and sobering figures, but they are not "90% within the first year" by any methodology that holds up to scrutiny.
"The 'most startups fail' narrative is both true and wildly overstated, depending on what you mean by startup and what you mean by fail. The data we have is better and more interesting than the number everyone keeps repeating." - Dane Stangler, Ewing Marion Kauffman Foundation
This piece compiles the actual data on new business and startup survival, industry differences, VC versus bootstrapped outcomes, and the factors that research most consistently associates with survival.
If you are founding a company, investing in one, or simply trying to understand the real landscape of entrepreneurial risk, the numbers that follow are more useful than the myth.
Where the 90% Figure Comes From
The "90% of startups fail" statistic has become one of the most durable factoids in business culture, yet tracing it to a single authoritative source is surprisingly difficult.
The figure appears to have emerged from a combination of venture capital lore and a few specific studies that were generalized far beyond their original context.
One traceable source is a 2012 report by Shikhar Ghosh, a senior lecturer at Harvard Business School, who studied 2,000 venture-backed companies and found that roughly 75% failed to return investors' capital.
When Ghosh broadened the definition of failure to include companies that did not meet their projected return on investment, the figure approached 95%.
The Wall Street Journal reported his findings under headlines that simplified the nuance, and the "90%" figure crystallized in popular discourse.
Another contributing source is the Startup Genome Project, founded by researchers Bjoern Lasse Herrmann and Max Marmer in 2011, which analyzed over 3,200 high-growth technology startups and reported that 92% of startups failed within three years.
However, their sample was deliberately skewed toward ambitious, high-growth technology ventures - not neighborhood restaurants or accounting firms.
The critical issue is selection bias. These studies examined a very specific population - venture-aspiring, high-growth technology companies - and their findings were generalized to "startups" as a whole, a category that includes everything from a solo freelance consultancy to a pre-revenue biotech company burning through $5 million a month.
The conflation of these vastly different types of businesses under a single failure rate is statistically meaningless.
Key Definitions
New Business Survival Rate: The BLS tracks the survival of "new establishments" - businesses that opened in a given quarter - over subsequent years. This is the most rigorous longitudinal data on business survival in the United States, covering all industries and all sizes.
It does not distinguish between "startups" (venture-aspiring tech companies) and small businesses (local service providers).
Startup Failure (VC Context): In venture capital, a startup "fails" if it does not return investors' capital. This includes companies that shut down, companies that are acquired for less than invested capital, and companies that operate indefinitely at below-threshold scale.
This is a much stricter definition than BLS's "establishment closure."
Premature Scaling: The Startup Genome Project's term for the pattern of companies that expand spending, hiring, and marketing before achieving product-market fit. It is the most common identified failure pattern in their analysis of over 10,000 startups.
Product-Market Fit (PMF): The condition in which a product satisfies a strong market demand - characterized by organic user growth, high retention, and customers who would be "very disappointed" if the product disappeared.
Typically measured via the Sean Ellis test, where 40%+ of users expressing strong disappointment signals PMF.
Runway: The number of months a startup can operate before running out of cash at its current burn rate. A common heuristic is to maintain 18-24 months of runway; falling below 6 months without a clear path to profitability or fundraising is considered a danger zone.
Survival Rates by Year: What the BLS Data Shows
The Bureau of Labor Statistics' Business Employment Dynamics (BED) data tracks the survival of all new business establishments in the United States over time. It is the most methodologically consistent and comprehensive dataset available for answering the question "how long do new businesses last?"
The data, analyzing cohorts of new establishments from 1994 through 2023, shows strikingly consistent survival curves across decades:
| Year of Operation | % of New Businesses Still Open | Cumulative Closure Rate |
|---|---|---|
| Year 1 | ~80% | ~20% |
| Year 2 | ~70% | ~30% |
| Year 3 | ~62% | ~38% |
| Year 5 | ~55% | ~45% |
| Year 10 | ~35% | ~65% |
| Year 15 | ~25% | ~75% |
Source: BLS Business Employment Dynamics, cohorts 1994-2023. Survival = establishment still operating in any form. Figures are averages across all industries.
These figures represent survival of any kind - the business is still operating in some form, regardless of its financial performance, ownership structure, or industry. "Survival" does not mean "thriving" or "achieving its founders' goals." It means the establishment has not closed.
Several patterns in the BLS data deserve attention. The first year is the most dangerous: one in five businesses closes before their first anniversary. But the rate of closure decelerates over time. If a business survives its first five years, the conditional probability of surviving another five years improves markedly.
This is consistent with what researchers call the liability of newness - a concept introduced by sociologist Arthur Stinchcombe in 1965 - which holds that new organizations face systematically higher mortality rates because they lack established routines, customer relationships, and reputational capital.
Importantly, BLS data also captures that the 2010s showed modestly better survival rates than the 1990s and early 2000s, consistent with research suggesting that improved access to business tools, cloud computing, and low-cost digital marketing have reduced some barriers to early-stage survival.
The improvement is meaningful but not dramatic - a few percentage points across the 5-year and 10-year survival windows.
Survival Rates by Industry
The BLS data allows for industry-level analysis that reveals significant variation. Not all businesses face the same odds, and industry choice is one of the strongest predictors of survival.
Construction has among the lowest survival rates, with approximately 42% of new construction firms surviving five years.
The combination of project-based cash flow, intense competition, thin margins, and vulnerability to economic cycles makes construction one of the most challenging industries for new business formation.
A single delayed payment from a general contractor can cascade into insolvency for a small subcontractor.
Retail - particularly single-location retail - shows approximately 44% five-year survival. The structural headwinds from e-commerce, rising commercial rents in viable locations, and competition from national chains have worsened retail survival rates over the past decade relative to the longer historical average.
Food and beverage / restaurants are frequently cited with survival rate statistics that vary wildly. The actual BLS data puts independent restaurant survival at approximately 40% after five years - challenging, but not the 90% failure rate often cited in popular media.
The popular overstatement appears to trace to a 1990s study by Professor H.G. Parsa at Ohio State University (later published in the Cornell Hotel and Restaurant Administration Quarterly in 2005) that measured failure rates differently and in a specific local market.
Parsa himself later noted that the "90% fail" figure for restaurants was a myth.
Professional and technical services (consulting, engineering, software) show substantially better survival rates - approximately 58% at five years. Lower capital requirements, scalable business models (particularly for software), and demand from enterprise clients contribute to better survival outcomes.
Healthcare and social assistance businesses show among the highest survival rates (approximately 61% at five years), benefiting from steady demand, insurance reimbursement systems, and barriers to entry that limit competition.
Software-as-a-Service (SaaS) companies with recurring revenue models represent a notable subcategory.
While not tracked separately by the BLS, research from Pacific Crest Securities (now part of KeyBanc Capital Markets) and OpenView Partners suggests that SaaS companies that achieve $1 million in annual recurring revenue have significantly better survival prospects than the average new business, largely because subscription revenue provides predictability that project-based or transactional revenue does not.
VC-Backed Startup Outcomes
Venture-funded startups represent a small fraction of all new businesses - approximately 0.5% of new businesses in the US receive any venture capital in a given year, according to the National Venture Capital Association - but they receive the overwhelming majority of attention in startup culture, business media, and entrepreneurship education.
The VC math starts with the expectation of a power law distribution of returns. VC fund models typically assume that most portfolio companies will either fail outright or return minimal capital, a small number will provide modest returns, and one or two will generate the dominant share of the fund's profits.
A commonly cited heuristic in VC is the "rule of thirds": approximately one-third of portfolio companies fail (return zero capital), one-third return invested capital or a modest multiple, and one-third generate meaningful returns.
Cambridge Associates' benchmarking data, which aggregates venture fund performance across hundreds of funds, shows that the median venture-backed startup returns less than the original invested capital to its investors. The best-performing quartile of VC-backed startups accounts for the overwhelming majority of industry returns.
This is the mathematical reality of venture capital: it is a hits-driven business where a small number of massive successes subsidize a large number of failures.
CB Insights' analysis of US venture-backed startups funded between 2008 and 2018 found that approximately 67% of startups that raised a Series A round ultimately did not return investors' capital through any exit route (IPO, acquisition, or secondary sale).
The percentage returning capital meaningfully to all investors (including early-stage) was lower still, approximately 10-20% depending on fund vintage and sector.
The unicorn - a venture-backed company reaching a $1 billion valuation - has become a widely tracked metric. As of late 2025, approximately 1,500 companies globally hold unicorn status, per CB Insights. The US leads with approximately 700 active unicorns, followed by China (approximately 300) and India (approximately 70).
Notably, the unicorn list is crowded with companies that achieved the $1 billion valuation threshold during the 2020-2021 bull market and have seen valuations collapse in subsequent down rounds or markdowns - so the list overstates the count of currently thriving billion-dollar companies.
Research by Ilya Strebulaev at Stanford Graduate School of Business (2020) found that approximately 50% of unicorns were overvalued relative to their fair market value when accounting for the complex financial structures of venture deals, including liquidation preferences, ratchets, and anti-dilution provisions.
The gap between headline valuation and economic reality is one of the least understood aspects of startup statistics.
Why Startups Fail: The Research
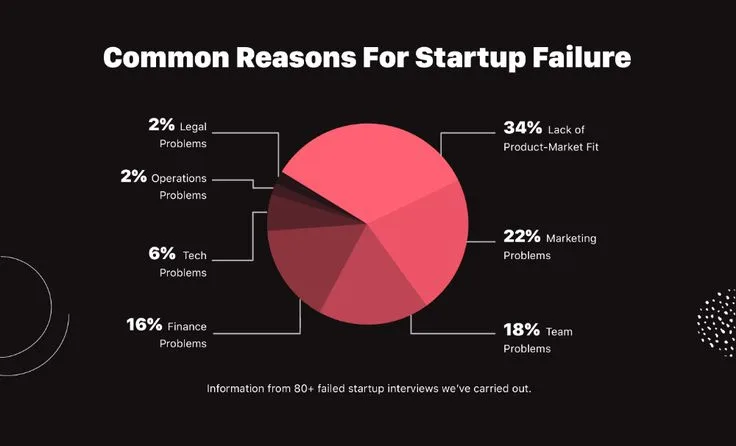
CB Insights' post-mortem analysis is one of the most frequently cited sources on startup failure reasons. Their analysis of over 110 startup post-mortems identifies the following as the most common failure factors:
No market need (42% of cases): The product solved a problem that either did not exist at meaningful scale or that potential customers did not prioritize sufficiently to pay for. This is the "brilliant solution looking for a problem" failure mode.
As venture capitalist Marc Andreessen has written, "The number one company-killer is lack of market."
Ran out of cash (29%): The company exhausted its capital before reaching a sustainable revenue base. Commonly associated with premature scaling, extended sales cycles (particularly in enterprise sales), and failure to raise follow-on funding.
Not the right team (23%): Skill gaps, co-founder conflict, and inability to attract talent are all captured in this category.
Research by Noam Wasserman at Harvard Business School, published in his 2012 book The Founder's Dilemmas, found that 65% of startup failures attributed to "people problems" stemmed from co-founder conflicts over roles, decision-making authority, and equity splits.
Got outcompeted (19%): The product was viable, but a better-resourced, better-executed, or earlier-moving competitor captured the market.
Pricing/cost issues (18%): The unit economics never worked - either the cost of acquiring customers exceeded lifetime customer value, or margins were insufficient to sustain a viable business, or pricing was misaligned with willingness to pay.
The Startup Genome Project's research identifies premature scaling as the underlying pattern in the majority of failures - often appearing before or alongside the specific reasons listed above.
Companies that scale prematurely - hiring ahead of revenue, expanding marketing before proving product-market fit, building operations for a scale they have not reached - are 2.3x more likely to fail than those that scale after establishing product-market fit.
Bootstrapped vs. Venture-Backed Outcomes
The comparison between bootstrapped (self-funded) and venture-backed startups is complicated by selection effects: the types of businesses that bootstrap and those that seek venture capital are fundamentally different in their ambitions, models, and industries.
Profitable, sustainable bootstrapped businesses are common and largely invisible in business media - they do not make headlines because they neither raise money publicly nor go public.
Indie Hackers, a community platform for bootstrapped founders (acquired by Stripe in 2017), documents thousands of profitable software businesses generating $10,000 to $1 million+ in monthly recurring revenue with no external investment.
These businesses have high survival rates precisely because profitability means they are not dependent on external capital cycles.
Academic research by Alicia Robb and David Robinson (2014, published in The Review of Financial Studies) found that bootstrapped startups showed lower short-term survival rates than funded startups (because capital access provides runway), but among survivors, bootstrapped businesses were more likely to be genuinely profitable after 3-5 years.
The funded businesses had higher survival but more often were "alive but walking dead" - burning capital without a clear path to profitability.
The Kauffman Foundation's research on entrepreneurship consistently finds that the vast majority of successful small businesses in America were started with less than $50,000 in capital, often from personal savings, credit cards, and loans from friends and family.
The median startup cost for a new employer business in the US is approximately $30,000, according to Kauffman's analysis of Census Bureau data.
The question of which model produces better outcomes for founders depends entirely on what founders want. Venture capital optimizes for magnitude of outcome at the expense of probability - you might get a large exit, or you might get zero.
Bootstrapping optimizes for probability of a stable, profitable outcome at the expense of potential magnitude.
Neither is objectively superior. For a deeper look at the cultural forces shaping these choices, see startup culture and the move-fast philosophy.
What Predicts Survival: The Evidence
Several factors emerge consistently across the research literature as the strongest predictors of startup survival.
Founder experience is the most reliable single predictor. Research by Paul Gompers, Anna Kovner, Josh Lerner, and David Scharfstein (2010, published in Journal of Financial Economics) found that entrepreneurs who had previously founded a venture-backed company that went public had a 30% success rate on their next venture, compared to 21% for first-time entrepreneurs.
The learning from failure and the networks built through prior startup experience are both significant.
Notably, Gompers et al. found that the performance advantage persisted even after controlling for the quality of the business idea - experienced founders were better at execution, not just idea selection.
Co-founder configuration matters. Partnerships (specifically complementary technical and commercial co-founders) outperform solo founders and functionally-similar co-founder pairs.
A First Round Capital analysis of their portfolio over 10 years found that two-founder companies raised 30% more investment, grew customer base 3x faster, and were 19% less likely to scale prematurely than solo-founded startups.
The decision-making advantages of having a partner who challenges your assumptions and covers your blind spots appear to be substantial.
Market timing may matter more than product quality. Bill Gross, founder of startup incubator Idealab, analyzed 200 companies from both his portfolio and the broader market in a widely cited 2015 TED Talk and concluded that timing was the single most important factor in startup success - accounting for 42% of the difference between success and failure.
Being too early is almost as fatal as being too late, because an early-to-market company exhausts resources before the market is ready.
Revenue orientation from day one is strongly associated with survival. Profitable small software companies (SaaS bootstraps, micro-SaaS, consulting-led product companies) show dramatically better survival rates than companies that delay revenue focus in pursuit of scale.
The Lean Startup methodology, articulated by Eric Ries in his 2011 book of the same name, emphasizes validated learning and early customer revenue - an approach supported by the empirical survival data.
Geographic location plays a measurable role. Research by the Kauffman Foundation and the Global Entrepreneurship Monitor (GEM) consistently shows that startups in ecosystems with dense networks of mentors, investors, and potential customers - particularly Silicon Valley, New York, Boston, and increasingly Austin, Miami, and London - have modestly better survival and growth outcomes.
The effect is partially explained by access to capital and talent, but network effects and knowledge spillovers also contribute.
The International Perspective
Startup failure rates are not unique to the United States. The OECD'sEntrepreneurship at a Glance reports (most recently 2023) show broadly similar patterns across developed economies, though with meaningful variation.
European startups tend to show slightly higher five-year survival rates than American ones (approximately 50-55% versus 45-50%), but this reflects differences in business formation rates and risk tolerance rather than superior European entrepreneurship.
The US produces far more new businesses per capita, including more high-risk ventures. European business culture tends toward more conservative growth strategies, which increases survival at the cost of fewer breakout successes.
Israeli startups represent an interesting case study. Israel has more startups per capita than any other country and a disproportionate share of global venture capital investment (approximately 15% of global VC relative to GDP).
The failure rate for Israeli startups is comparable to or slightly higher than US rates, but the ecosystem produces an outsized number of successful exits, particularly in cybersecurity and enterprise software.
Dan Senor and Saul Singer documented this phenomenon in their 2009 book Start-Up Nation.
Practical Implications
For aspiring entrepreneurs, the most important implication of the data is that failure is common but not inevitable, and that specific factors under founders' control significantly affect the odds.
Building with a complementary co-founder, validating market need before building extensively, and maintaining tight cost control during the pre-product-market-fit phase all improve odds substantially.
The data also suggests that industry choice matters enormously - a first-principles analysis of which sectors offer structural advantages is worth the time before committing.
For investors, the power law distribution of VC returns is a mathematical feature of the asset class, not a failure of execution. Portfolio construction strategies that maximize the number of shots at high-return outcomes - while maintaining discipline on entry valuation - remain the core VC investment logic.
For policymakers, the BLS data shows a relatively stable rate of new business formation and survival across decades, with small improvements in recent years.
The research identifies access to early revenue (government procurement programs, university technology transfer) and mentorship (accelerator programs, SBIR grants) as the most evidence-backed policy interventions for improving startup survival.
For everyone else, the key takeaway is epistemic: be suspicious of round numbers and dramatic statistics, especially when they serve a narrative purpose. The real data on startup failure is interesting, nuanced, and actionable. The myth is just a myth.
Sources & Further Reading
- Bureau of Labor Statistics. (2024). Business Employment Dynamics: Survival of Private-Sector Establishments. View source
- CB Insights. (2021, updated 2024). The Top 12 Reasons Startups Fail. View source
- Startup Genome Project. (2019, updated 2023). Global Startup Ecosystem Report. View source
- Gompers, P., Kovner, A., Lerner, J., & Scharfstein, D. (2010). Performance Persistence in Entrepreneurship. Journal of Financial Economics, 96(1), 18-32.
- Robb, A.M., & Robinson, D.T. (2014). The Capital Structure Decisions of New Firms. Review of Financial Studies, 27(1), 153-179.
- Parsa, H.G., et al. (2005). Why Restaurants Fail. Cornell Hotel and Restaurant Administration Quarterly, 46(3), 304-322.
- Ghosh, S. (2012). The Venture Capital Secret: 3 Out of 4 Start-Ups Fail. Wall Street Journal. View source
- First Round Capital. (2019). The 10 Year Project: Insights from 10 Years of Investing. View source
- Cambridge Associates. (2024). US Venture Capital Index and Selected Benchmark Statistics. View source
- Kauffman Foundation. (2023). State of Entrepreneurship 2023. View source
- Wasserman, N. (2012). The Founder's Dilemmas: Anticipating and Avoiding the Pitfalls That Can Sink a Startup. Princeton University Press.
- Ries, E. (2011). The Lean Startup. Crown Business.
- Strebulaev, I. & Gornall, W. (2020). Squaring Venture Capital Valuations with Reality. Journal of Financial Economics, 135(1), 120-143.
- OECD. (2023). Entrepreneurship at a Glance 2023. View source
- Senor, D. & Singer, S. (2009). Start-Up Nation: The Story of Israel's Economic Miracle. Twelve Books.
Frequently Asked Questions
What is the actual startup failure rate?
BLS data shows 20% of new businesses close in year 1, 45% by year 5, and 65% by year 10, not the widely cited ‘90% fail.’ The higher VC-specific figure (approximately 75% don’t return investor capital) applies only to a narrow slice of venture-backed tech companies, not all new businesses.
What are the most common reasons startups fail?
CB Insights’ analysis of 110+ post-mortems: no market need (42%), ran out of cash (29%), wrong team (23%), got outcompeted (19%), pricing problems (18%). The Startup Genome Project identifies premature scaling as the underlying pattern, companies that scale before product-market fit are 2.3x more likely to fail.
Do VC-backed startups fail more or less than bootstrapped startups?
VC-backed startups survive longer short-term (capital provides runway) but face a stricter definition of success, only 10-15% achieve the exits that produce meaningful venture returns. Bootstrapped survivors are more likely to be genuinely profitable after 3-5 years, per Robb and Robinson (2014).
Which industries have the highest and lowest startup failure rates?
Construction (~42% 5-year survival), retail (~44%), and restaurants (~40%) have the worst rates. Healthcare/social assistance (~61%) and professional/technical services (~58%) have the best. SaaS with recurring revenue outperforms consumer apps significantly.
What factors most predict startup survival?
Founder experience is the strongest predictor, second-time founders succeed at ~30% higher rates. Complementary co-founders (technical + commercial) outperform solo founders. Market timing, revenue focus from day one, and scaling only after product-market fit all substantially improve odds.