The average American adult spends approximately 7 hours and 4 minutes per day looking at screens. That is more time than they spend sleeping, and in many households, more time than they spend on all other activities combined.
Globally, the figure for adults is approximately 6 hours and 58 minutes per day across smartphones, televisions, computers, and tablets.
Teenagers in the United States average over 7 hours of recreational screen time daily, before adding in school-related screens, which can push the total to 9-10 hours.
These numbers are not metaphors or estimates constructed to provoke alarm. They come from large-scale panel research by DataReportal, GWI, Common Sense Media, and Nielsen, organizations that track actual device usage rather than self-reported estimates (which consistently run lower than measured figures).
The gap between what people believe they spend on screens and what their devices actually record is consistently significant: when Apple introduced Screen Time reporting and Android added Digital Wellbeing dashboards, the results were, by most accounts, surprising to the people reading them.
What the screen time data tells us in 2026 is not simply that people use screens a lot, that is not news.
It tells us how the composition of screen use has shifted post-pandemic, which age groups show the most extreme usage patterns, how device habits break down across smartphones versus TV versus computers, and what the growing body of health research actually shows about the consequences of all that screen-facing time.
"Screen time is not one thing. Nine hours reading scientific papers is not the same as nine hours scrolling short-form video. The research is increasingly specific about which types of screen use cause harm, and which do not.", Amy Orben, MRC Cognition and Brain Sciences Unit, Cambridge, 2024
Key Definitions
Recreational Screen Time: Screen use for entertainment, social media, gaming, and casual browsing, as distinct from occupational screen use (working on a computer) or educational screen use (distance learning, educational apps). Most guidelines for children and most public health discussions focus on recreational screen time.
Passive vs. Active Screen Use: A distinction increasingly important in the research literature. Passive screen use involves consuming content without interaction (watching video, scrolling feeds). Active screen use involves interaction, creation, communication, or deliberate learning.
Research generally finds passive use more associated with negative outcomes.
Near Work: Visual tasks performed at close range, including reading, writing, computer work, and smartphone use. Associated with myopia (nearsightedness) development in children in multiple research studies, independent of broader screen time debates.
Blue Light: Short-wavelength visible light (wavelength 380-500 nm) emitted by LCD and OLED screens. Associated with suppression of melatonin production when viewed in the hours before sleep. The degree to which blue light from screens causes harm beyond general bright light exposure is debated in the research literature.
Digital Wellbeing: A category of app and operating system features designed to provide users with visibility and controls over their device usage. Includes Screen Time on iOS, Digital Wellbeing on Android, and similar features on most major platforms.
Global Screen Time Averages by Device
DataReportal's 2026 Digital Overview Report, drawing on GWI's global panel of approximately 850,000 respondents across 53 countries, provides the most comprehensive cross-national screen time data available.
Global average daily screen time across all devices: 6 hours 58 minutes. By device breakdown: smartphones account for approximately 3 hours 15 minutes, television approximately 2 hours 45 minutes, computers/laptops approximately 1 hour 10 minutes, and tablets approximately 30 minutes.
Music and audio streaming devices add approximately 1 hour per day, though these are not typically counted as 'screen' time.
The United States shows somewhat higher overall screen time than the global average. Nielsen's Total Audience Report for 2025 puts US adult TV viewing at approximately 4 hours 30 minutes per day when both live television and streaming are combined.
This is the single largest component of adult screen time in the US and Europe, though smartphone time is catching up among adults under 40.
South Korea, Brazil, and China show among the highest smartphone screen time globally, each averaging over 4 hours per day on smartphones alone.
Japan and Germany show lower smartphone screen time (approximately 2.5 hours), consistent with cultural norms around public smartphone use and a higher relative balance toward desktop computing in professional settings.
When work screens are excluded (to measure leisure screen time only), US adult average drops to approximately 4 hours 30 minutes, still substantial, but substantially below the total figure that includes occupational screen use.
Screen Time by Age Group
| Age Group | Recommended Daily Screen Time | Actual Average (Recreational) | Primary Activity |
|---|---|---|---|
| Ages 0-2 | Avoid (except video calls) | ~1 hr 28 min | Passive TV viewing |
| Ages 2-5 | Up to 1 hour | ~2 hr 52 min | Streaming video, educational apps |
| Ages 8-12 | Parents guide | ~4 hr 44 min | Social media, streaming |
| Ages 13-18 | Parents guide | ~7 hr 22 min | TikTok, YouTube, social media |
| Adults 18-34 | N/A | ~7-8 hrs total | Streaming, social media, gaming |
| Adults 55+ | N/A | Similar total | TV dominant (~60% of screen time) |
Age is the most powerful predictor of screen time patterns, and the data across age groups reveals a complex picture that does not match simple 'younger = more screens' assumptions.
Children aged 0-2: Official guidance from the American Academy of Pediatrics recommends avoiding digital media other than video-chatting entirely for children under 18 months.
Common Sense Media's 2023 Census found that approximately 26% of infants aged 0-2 had measurable recreational screen time averaging 1 hour 28 minutes per day, primarily passive TV viewing.
Research on this age group consistently shows no educational benefit and potential disruption to language acquisition from passive screen exposure.
Children aged 2-5: AAP recommends no more than 1 hour per day of high-quality programming for this age group, ideally co-viewed with parents. Common Sense Media found actual daily recreational screen time averaging 2 hours 52 minutes, almost triple the recommendation.
The most common activities were streaming video (primarily YouTube Kids, Netflix, and Disney+) and educational apps.
Children aged 8-12 (tweens): This age group shows the most significant increase in screen time over the past decade. Common Sense Media's 2023 Census found average daily recreational screen time of 4 hours 44 minutes, up from 2 hours 19 minutes in their 2011 benchmark study.
Smartphones enter this age range, and social media use begins, typically on platforms that officially require users to be 13+.
Teenagers aged 13-18: The highest recreational screen time of any measured age group, at approximately 7 hours 22 minutes per day, per Common Sense Media. This figure has grown by approximately 90 minutes since their 2015 study.
Social media and video (primarily YouTube and TikTok) account for the majority. When school screens are added, total daily screen time for US teenagers likely exceeds 9 hours on schooldays.
Adults aged 18-34: Approximately 7-8 hours total including work and leisure. Smartphone-dominant, with significant streaming video and social media use. This age group shows the highest mobile gaming engagement.
Adults aged 35-54: Approximately 7-9 hours total, with higher TV viewing relative to smartphone, and higher work computer use.
Adults aged 55+: Total screen time roughly equivalent to younger adults due to television's prominence, but smartphone time is lower. Television accounts for approximately 60% of screen time for adults over 55.
COVID-19's Lasting Impact on Screen Habits
The COVID-19 pandemic produced the most abrupt and dramatic change in screen time behavior ever measured. Understanding the pandemic impact requires distinguishing the acute phase (spring 2020 lockdowns), the extended pandemic period (2020-2022), and the post-pandemic reversion (2022-present).
During spring 2020 lockdowns, Nielsen data showed US adult TV viewing increasing approximately 60% above the prior-year baseline. Streaming subscriptions surged, Netflix added 37 million subscribers in the first half of 2020 alone, more than in the entire preceding year.
Smartphone screen time increased 20-25% above pre-pandemic levels, driven by a combination of social media (seeking connection and information), video calling (substituting for in-person meetings), and entertainment.
Among children, the effect was more extreme. Common Sense Media's interim surveys during lockdowns found recreational screen time approximately doubling for school-age children, as schools closed and organized activities were cancelled.
The combination of remote schooling (educational screen time increasing dramatically) and recreational screen use meant children's total daily screen exposure reached historic highs.
By 2023-2024, adult screen time had partially but not fully reverted toward pre-pandemic levels. Most estimates suggest adult leisure screen time settled approximately 30-45 minutes per day above the pre-2020 baseline.
The specific activities that expanded most, streaming video, video calling, became permanent habits for large portions of the population.
Children's screen time has reverted less fully than adult screen time. The habits formed during remote schooling periods, combined with schools adopting more device-intensive pedagogy, have meant that children's baseline screen time post-pandemic is structurally higher than 2019 levels.
Common Sense Media's 2023 update found tween and teen screen time approximately 60-90 minutes per day higher than their 2019 survey, even excluding school use.
What People Actually Do on Screens
Understanding screen time requires understanding not just duration but content. The 'what people are doing' question substantially affects how the data should be interpreted for health and behavioral purposes.
On smartphones, data from App Annie/data.ai's 2026 State of Mobile Report, drawing on app usage measurement across millions of opted-in devices, shows the following breakdown of active time: entertainment and streaming video 35%, social media 27%, games 16%, communication (messaging, calls) 12%, productivity and utilities 10%.
This breakdown varies significantly by age and country. For users under 25, TikTok and YouTube claim the dominant share of smartphone screen time. For users over 40, communication apps (WhatsApp, iMessage, Facebook Messenger) and news apps are more prominent.
In markets like South Korea and Japan, mobile gaming represents a much higher share of smartphone time than the global average.
Television content composition has shifted dramatically. Nielsen's 2025 data shows that streaming now accounts for approximately 42% of all US TV viewing, exceeding broadcast television (approximately 22%) and cable (approximately 29%) for the first time in 2024.
Netflix, YouTube (on connected TVs), Amazon Prime Video, and Disney+ collectively account for the majority of streaming time. YouTube on connected TVs has been one of the fastest-growing content categories, with people increasingly watching YouTube through their televisions rather than laptops or phones.
Computer/laptop screen time is disproportionately work-related during weekdays and entertainment-related on evenings and weekends. The primary leisure activities on computers include video streaming, online gaming (particularly for adult male demographics), and web browsing.
The activity breakdown matters for health purposes. Passive streaming of video (particularly narrative series) shows weaker associations with negative outcomes than passive social media scrolling.
Gaming, while frequently targeted in moral panic narratives, shows associations with both positive outcomes (cognitive skill development, social connection for cooperative games) and negative outcomes (compulsive use, displacement of sleep and physical activity) depending on use patterns.
Health Effects: What the Research Supports
The research on screen time's health effects has become substantially more specific and nuanced over the past decade, moving away from blanket warnings toward differentiated analysis by age, content type, and use pattern.
Sleep disruption is one of the most robust and consistently replicated findings.
A 2023 meta-analysis in Sleep Medicine Reviews, analyzing 35 studies covering over 75,000 participants, found that screen use within 60 minutes of bedtime was associated with significantly reduced sleep duration (average 28-minute reduction), delayed sleep onset (average 23-minute delay), and reduced sleep quality scores across all age groups.
Blue light suppression of melatonin is one proposed mechanism, but research also indicates that the stimulating nature of content (particularly social media and video games) independently affects arousal and sleep onset.
Myopia (nearsightedness) and screen time show an increasingly documented association. A 2023 JAMA Ophthalmology meta-analysis of 45 studies found that each additional hour per day of near-work was associated with measurable increases in myopia prevalence and progression.
The same analysis found that time outdoors was significantly protective against myopia development in children, an effect attributed to bright light exposure and distance vision rather than merely replacing near work.
Given that myopia rates in urban populations (particularly in East Asian cities, where rates exceed 80% in some young adult populations) have surged alongside smartphone adoption, this is increasingly considered a significant public health concern.
Sedentary behavior associated with prolonged screen use is associated with cardiovascular health risks, independent of screen content or type. The concern is not the screens per se but the reduction in physical activity they typically displace.
Children and adults who meet physical activity guidelines while also having high screen time show better health outcomes than those who are sedentary, suggesting the primary risk factor is inactivity rather than screen exposure directly.
For mental health, the literature as of 2025 supports the following distinctions: passive social media use (scrolling without interacting) is associated with increased loneliness, lower self-esteem, and depression symptoms, particularly in adolescents.
This effect is consistent across multiple peer-reviewed meta-analyses. Passive entertainment streaming (watching Netflix, YouTube) shows weaker or neutral associations. Active use of communication apps (messaging friends and family) shows neutral or slightly positive associations.
The design features that drive compulsive use, infinite scroll, algorithmic variable reward, notification systems, appear to be the specific mechanisms driving harm, rather than screen time per se.
Platform-Specific Screen Time Data
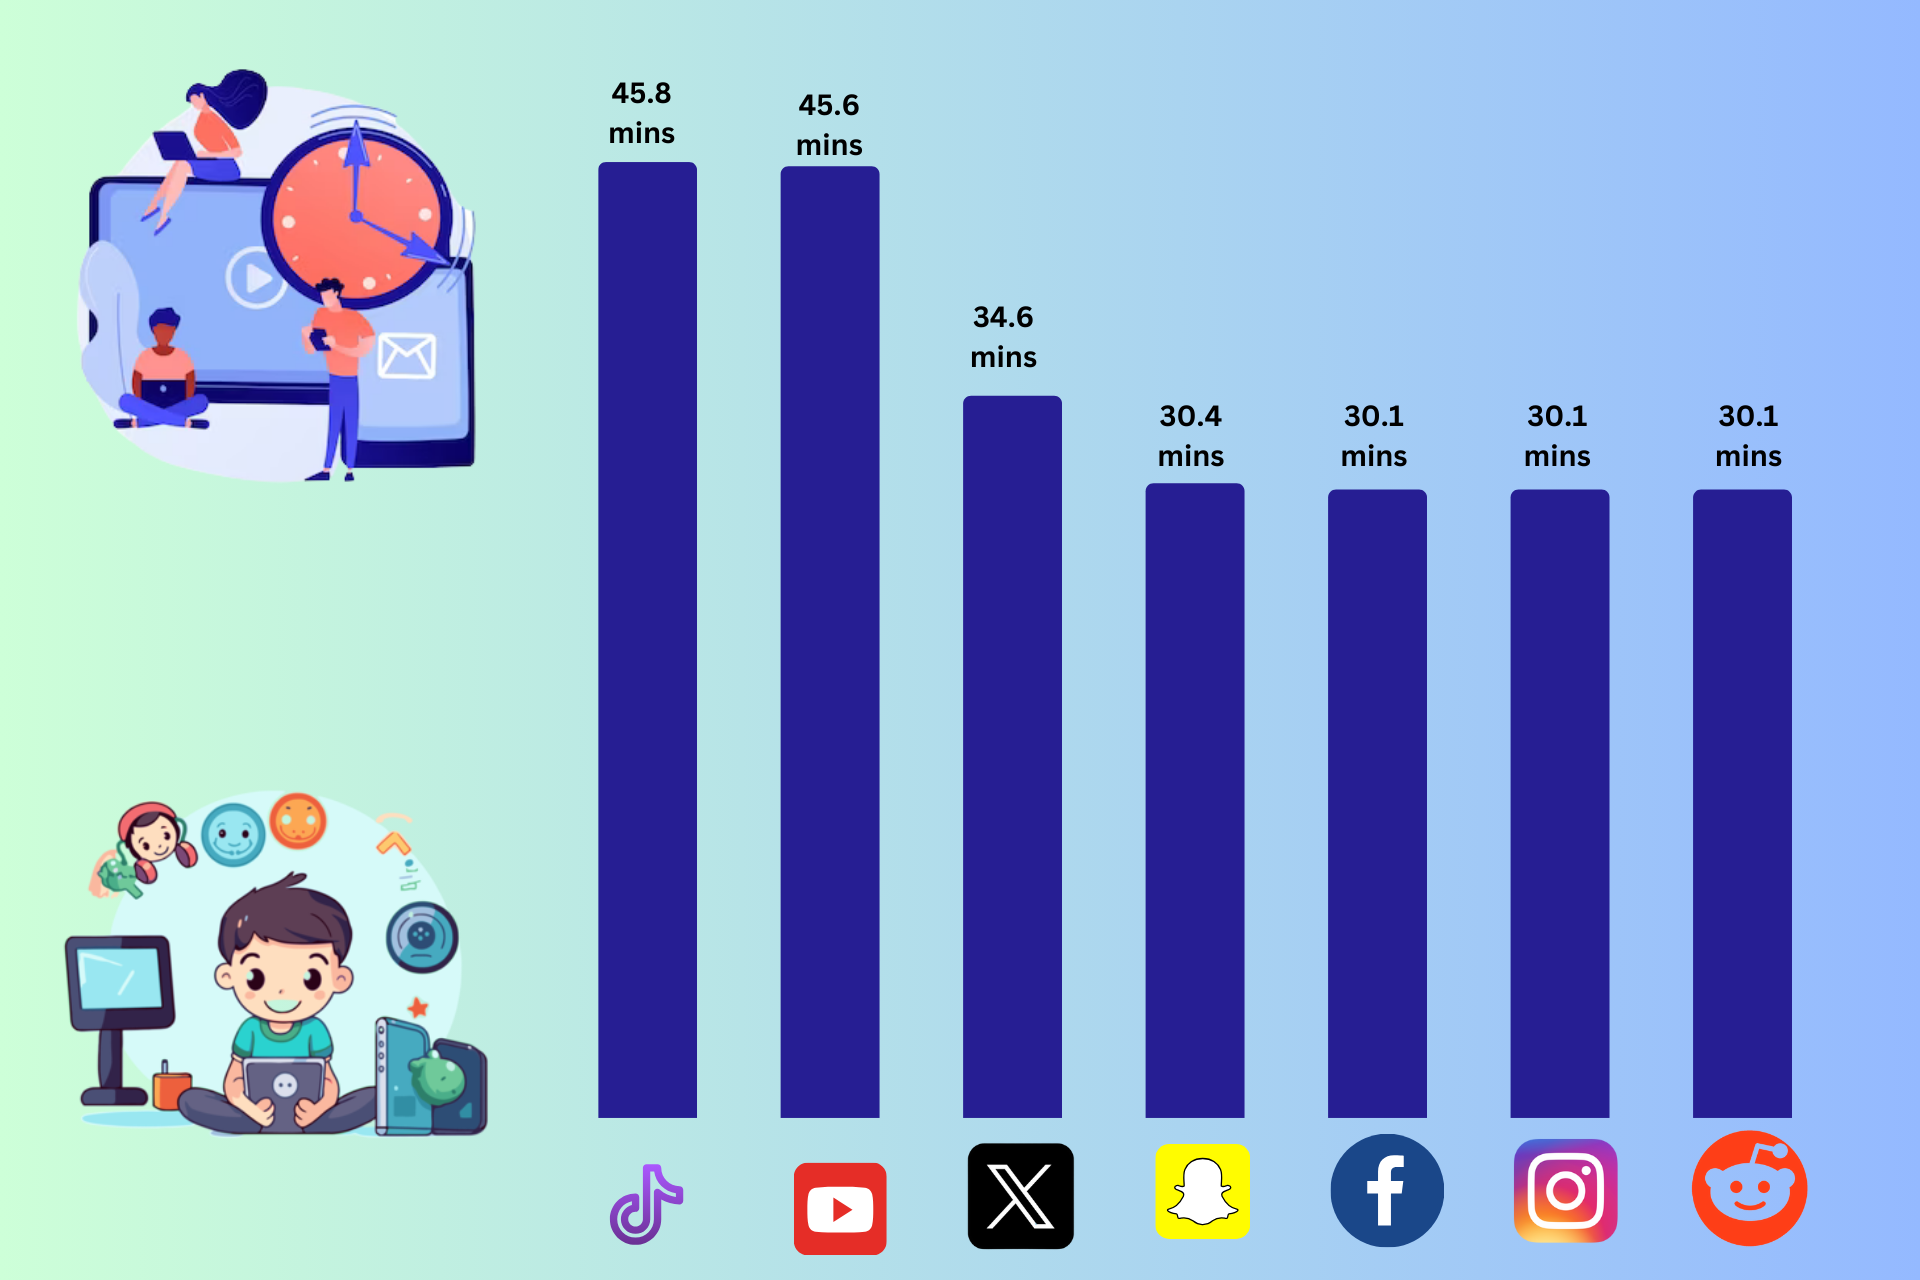
Netflix reported that its subscribers globally watched approximately 3.2 hours of Netflix content per day, on average, in Q4 2025. YouTube's own data (reported in blog posts and earnings calls) shows users globally watching over 1 billion hours of YouTube per day, averaging approximately 40 minutes per day per global internet user.
TikTok data from Comscore's 2025 US measurement shows the average TikTok session lasting 10.85 minutes, with users opening the app approximately 8 times per day, implying approximately 86 minutes per day of TikTok use among active users. This is not a global average but a US active-user average.
Gaming consoles and PC gaming represent a significant and often undercounted component of screen time. The Entertainment Software Association estimates that approximately 65% of US adults play video games, averaging approximately 7 hours per week. Among gamers under 18, average weekly game time is approximately 11-12 hours.
Practical Implications
For parents, the research supports graduated, context-sensitive approaches rather than total prohibition.
The most consistent finding is that content type and social context matter more than raw screen time: social media scrolling is more problematic than video calling family; gaming with friends is less problematic than solitary binge-viewing.
Screens in bedrooms (particularly smartphones accessible at night) show the strongest negative associations and are the most evidence-backed target for parental restriction.
For individuals concerned about their own screen habits, the research points toward two specific interventions with good evidence: removing smartphones from the bedroom to protect sleep, and setting specific times for social media use rather than leaving feeds available for habitual checking throughout the day.
Both produce measurable improvements in sleep quality and self-reported wellbeing in multiple studies.
For employers and policymakers, the occupational screen time question is becoming more significant as computer work expands. Ergonomic guidance, outdoor break policies, and consideration of near-work vision health in workforce health programs are all evidence-backed responses to documented occupational screen time health effects.
Sources & Further Reading
- DataReportal. (2026). Digital 2026 Global Overview Report. datareportal.com.
- Common Sense Media. (2023). Common Sense Census: Media Use by Tweens and Teens 2023. commonsensemedia.org.
- Nielsen. (2025). The Gauge: Total Audience Report 2025. nielsen.com.
- App Annie / data.ai. (2026). State of Mobile 2026. data.ai.
- GWI. (2026). Digital Consumer Trends 2026. gwi.com.
- American Academy of Pediatrics. (2016, updated 2022). Media and Young Minds. pediatrics.aappublications.org.
- Orben, A., & Przybylski, A.K. (2019). The association between adolescent well-being and digital technology use. Nature Human Behaviour, 3(2).
- Hale, L., & Guan, S. (2015). Screen time and sleep among school-aged children and adolescents. Sleep Medicine Reviews, 21.
- Enthoven, C.A., et al. (2020). Myopia and outdoor time. JAMA Ophthalmology.
- Twenge, J.M., Martin, G.N., & Campbell, W.K. (2018). Decreases in psychological well-being among American adolescents. Emotion, 18(6).
- Entertainment Software Association. (2025). 2025 Essential Facts About the Video Game Industry. theesa.com.
- Lissak, G. (2018). Adverse physiological and psychological effects of screen time on children and adolescents. Environmental Research, 164.
Frequently Asked Questions
What is the average daily screen time in 2026?
Global average daily screen time across all devices (smartphones, TVs, computers, tablets) is approximately 6 hours and 58 minutes per day for adults, according to DataReportal’s 2026 Digital Overview Report drawing on GWI panel data. The United States sits somewhat higher, with the average American spending approximately 7 hours and 4 minutes per day on screens. When broken down by device, smartphones account for approximately 3 hours 15 minutes, television approximately 2 hours 45 minutes, computers/laptops approximately 1 hour 10 minutes, and tablets approximately 30 minutes. There is significant overlap in measurement methodology across research sources, and estimates vary depending on whether work-related screen use is included. When work screens are excluded, leisure-only screen time averages approximately 4 hours 30 minutes per day for US adults.
How much screen time do children and teenagers have?
Screen time among children and teenagers exceeds the adult average in most age groups, despite the existence of official guidelines. The American Academy of Pediatrics recommends no more than 1 hour per day for children aged 2-5 and ‘consistent limits’ for children 6 and older. In practice, children aged 8-12 in the United States average approximately 4 hours and 44 minutes of daily recreational screen time, while teenagers average approximately 7 hours and 22 minutes, per Common Sense Media’s 2023 Census (the most recent comprehensive US study). Teenagers’ screen time figure excludes school-related screen use, with educational screens included, the total often exceeds 9-10 hours per day. COVID-19-era lockdowns pushed screen time to record highs that have partially but not fully reverted.
How did COVID-19 change screen time?
The COVID-19 pandemic produced the largest and most abrupt increase in screen time ever measured. Nielsen data showed that US adult TV viewing increased by approximately 60% during the spring 2020 lockdowns. Smartphone screen time increased approximately 20-25% above pre-pandemic levels. Children’s recreational screen time approximately doubled during peak lockdown periods, per Common Sense Media research. By 2022-2023, adult screen time had partially reverted toward pre-pandemic levels, though not fully, most estimates put 2023 adult leisure screen time approximately 30-45 minutes per day above the pre-2020 baseline. Children’s screen time has been more ‘sticky’, the habits formed during lockdown-era remote schooling and screen-based entertainment have persisted more durably than adult habits.
What are people actually doing on their screens?
Content consumption breakdown varies significantly by platform and device. On smartphones (per App Annie/data.ai’s 2025 State of Mobile report), entertainment and video streaming account for approximately 35% of time, social media 27%, games 16%, communication apps 12%, and productivity and utilities 10%. Television time is primarily streaming (Netflix, YouTube, Hulu, Disney+, etc.) rather than linear broadcast, streaming now accounts for approximately 42% of all US TV viewing time, per Nielsen, exceeding broadcast and cable combined for the first time in 2024. Video content (YouTube, streaming services, TikTok) accounts for approximately 65% of all screen time across devices when averaged across the US adult population.
What does research say about the health effects of screen time?
The health effects of screen time depend heavily on the type of use, the user’s age, and how ‘screen time’ is defined. For children under 18 months, virtually all research shows no educational benefit and potential language development delays from passive TV viewing. For children 2-12, the research identifies two robust concerns: screen time displacing physical activity, sleep, and face-to-face play, and specific associations between social media use and mental health problems in adolescents (particularly passive social media use). For adults, the primary documented concerns are blue light exposure disrupting sleep quality, sedentary behavior associated with prolonged screen use, and compulsive use patterns associated with variable-reward algorithm designs. The relationship between screen time and eyesight (myopia) is increasingly well-established: research from multiple Asian studies and a 2023 JAMA Ophthalmology meta-analysis found that children spending time outdoors showed significantly lower myopia rates, and that near-work screen use is associated with myopia progression.