Engaging: A college student wanted to understand why she always felt exhausted on Wednesdays regardless of how much sleep she got the night before.
She started a tracking experiment: recording sleep duration and quality, caffeine intake timing and amount, exercise, screen time by category, and self-reported energy level at three points during the day.
After 90 days of consistent tracking, she ran her first correlation analysis. The results surprised her. Her Wednesday fatigue correlated not with sleep duration on Tuesday night, but with late-night screen time two nights prior, on Sunday evenings.
The relationship had a two-day lag she would never have identified through introspection alone, because humans are poor at detecting non-immediate cause-and-effect relationships in their own behavior.
This is the characteristic promise of personal data analysis: systematic observation reveals patterns that intuition misses, and those patterns are often counterintuitive in ways that change behavior more durably than advice or information.
The student adjusted her Sunday evening screen use. The Wednesday fatigue improved. She had not read about this intervention in a wellness article; she had discovered it in her own data.
Data analysis projects represent one of the most accessible paths into analytical and statistical thinking, and one of the few technical skill domains where genuinely meaningful work is achievable from the earliest stages of learning.
Unlike many technical disciplines where beginner projects feel artificially constructed, data analysis on real data about questions you actually care about is real analysis, producing real insights, from the beginning.
Why Starting with Personal Data Works Better
The conventional advice for aspiring data analysts is to download a public dataset from Kaggle or data.gov and begin exploring. This advice is not wrong, but it underestimates an important practical reality: motivation. Analyzing someone else's data about a domain you have no connection to is an intellectual exercise.
Analyzing your own data about your own life, your own behavior, and your own questions is a personal investigation with stakes. The engagement difference is substantial.
Personal data projects also provide a decisive learning advantage: contextual knowledge.
When you analyze your own spending data, you know that the spike in March was because you moved apartments and paid a security deposit, that the restaurant spending in July reflects a trip you took, and that the software subscriptions that appear in three different months are actually quarterly billing cycles.
This contextual knowledge lets you focus on learning analytical techniques rather than simultaneously learning an unfamiliar domain.
"Data is not information, information is not knowledge, knowledge is not understanding, understanding is not wisdom." - Russell Ackoff
The progression from data to wisdom requires the contextual understanding that makes findings meaningful rather than merely statistical. Personal data provides that context from the start.
| Personal Data Source | Compelling Questions | Primary Skills Developed |
|---|---|---|
| Bank and credit card transactions | Spending patterns, category trends, seasonal variation | Data cleaning, time series analysis, visualization |
| Time tracking logs | Productivity patterns, allocation vs. stated priorities | Aggregation, heatmaps, correlation analysis |
| Fitness tracker and health apps | Activity vs. mood, sleep quality drivers | Statistical testing, multivariate analysis |
| Reading and media log | Genre preferences, completion rates, content satisfaction | Categorical analysis, cohort analysis |
| Social media accounts | Engagement patterns, content type performance | API usage, text analysis, time series |
| Email and calendar | Meeting load, response time patterns | Network analysis, time series |
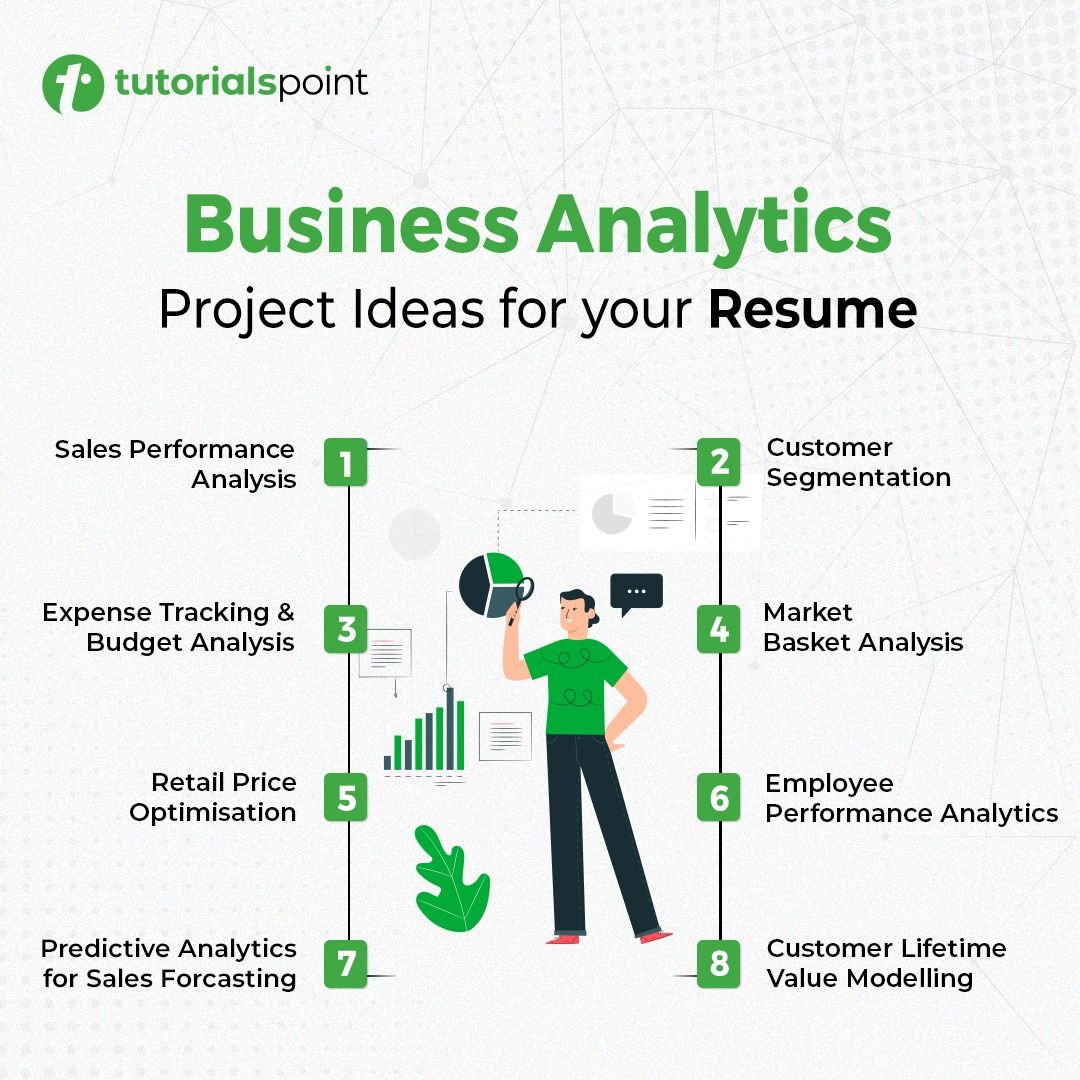
Project Ideas Organized by Complexity
Beginner Level: Descriptive Analysis
Beginner data projects answer the question "what happened?" using basic statistics (means, medians, totals, distributions) and clear visualizations (bar charts, line charts, histograms). The goal is not sophisticated technique but clarity of answer.
Personal finance analysis is the canonical starter project. Download transaction history from your bank and credit card accounts for the past 12 months.
Clean the data (merchants appear in inconsistent formats, categories need manual classification for ambiguous transactions, duplicates appear when transactions are pending and then settled).
Calculate monthly averages by category, identify the largest spending categories, visualize spending trends over time, and find anomalies - unusual months or transactions that require explanation.
The insights from this project are almost always immediately actionable, which makes it motivationally sustaining in a way that abstract exercises are not.
Most people who complete a rigorous personal finance analysis discover at least one significant spending pattern they were not consciously aware of, and at least one area where their actual spending substantially diverges from their stated priorities.
Skill development: data cleaning (the majority of time in any real analysis project), basic aggregation and summary statistics, time series visualization, and the discipline of formulating a specific question before looking at the data.
Reading and media consumption analysis is equally accessible. Maintain a log of books, articles, podcasts, or shows consumed over several months, including metadata: format, genre, time spent, completion, and satisfaction rating.
Analyze patterns: what genres do you actually engage with most versus what you think you prefer? What completion rate do different formats produce? What is the relationship between time investment and satisfaction?
This project teaches categorical data analysis and often surfaces insights about information consumption that are useful in themselves - which connects to how learning inefficiency problems can be addressed through more intentional content selection.
Intermediate Level: Diagnostic Analysis
Intermediate projects answer "why did it happen?" and begin to explore relationships between variables rather than just describing individual variables.
Productivity pattern analysis. Combine time tracking data with output metrics - tasks completed, words written, code commits, calls made, depending on your work type.
Identify the conditions under which your output is highest: time of day, day of week, whether you exercised that morning, how many meetings were scheduled, how much sleep you got the previous night. This is multivariate analysis applied to a question with immediate personal relevance.
The analytical challenge - which makes this excellent practice - is that productivity is confounded by dozens of variables simultaneously. Days when you exercise may also be days when you slept well; days when you sleep well may also be days with fewer meetings.
Separating these influences requires careful thinking about confounding variables and, eventually, experimental design.
Neighborhood or city data analysis. Local government datasets - crime statistics, property values, business licenses, permit applications, transit ridership - are available in most cities and provide rich analytical material for questions with genuine civic relevance.
What neighborhoods have seen the largest property value changes over the past decade? Where are new business licenses concentrated? How does transit ridership correlate with development patterns? These questions connect local data literacy to real decisions and policy discussions.
Example: FiveThirtyEight, the data journalism publication founded by Nate Silver in 2008, has made all of its datasets publicly available at github.com/fivethirtyeight/data.
These datasets cover elections, sports statistics, economic trends, and social phenomena - all connected to questions that were investigated by professional journalists, with the articles providing the analytical narrative for comparison with your own approach.
Advanced Level: Predictive and Experimental Analysis
Advanced projects answer "what will happen?" and "what causes what?" - moving from description and correlation to prediction and causal inference.
Personal forecasting. Use historical data to build models that predict future behavior. Predict next month's spending based on seasonal patterns and recent trends. Predict whether a book will hold your interest to completion based on genre, author, and opening engagement.
Predict your next week's productivity based on scheduled meetings and recent sleep patterns. This teaches time series analysis, model evaluation, and the critical skill of quantifying how uncertain predictions are - a skill that is poorly developed in most people's intuitive reasoning.
Designed experiments. Set up personal experiments with explicitly pre-registered hypotheses and measurable outcomes. Does a different morning routine affect your productive output? Does varying exercise timing affect sleep quality? Does a specific learning technique produce better retention than your current approach?
Personal experiments are genuinely valid scientific work when they are designed with clear hypotheses, randomized conditions, and honest outcome measurement.
The sample sizes are small, which limits the statistical confidence of conclusions, but the practice of experimental design - specifying what you will measure, how you will measure it, and what would constitute evidence for or against the hypothesis, before collecting data - is a valuable discipline that transfers broadly.
The Data Cleaning Reality: What Nobody Warns You About
Every data analysis guide mentions that data cleaning takes 80% of the time. Until you experience it firsthand, this claim is abstract. Your first real project will make it viscerally concrete.
Bank transaction data contains the same merchant in seventeen different name formats: "WHOLEFDS MKT #10349", "WHOLE FOODS MARKET", "WFM #10349", "Whole Foods 4291", and more. Dates are sometimes stored as text strings in non-standard formats.
Categories are ambiguous ("general merchandise" could be anything). Missing values appear at analytically inconvenient moments. Time zones create phantom patterns - a transaction at 11pm Eastern appears at 8pm Pacific.
Duplicate entries distort calculations - a transaction might appear as both "pending" and "settled" in different downloads.
This frustration is the most educationally valuable part of any first real data analysis project.
It teaches the foundational lesson that cannot be internalized from descriptions: your data is never as clean as you think, the quality of your analysis depends entirely on the quality of your data preparation, and the assumptions you make during cleaning can substantially change your conclusions.
Professionals who skip this lesson produce confident-looking analysis built on unreliable foundations.
The technical skills developed during data cleaning - string manipulation, regex patterns, date parsing, deduplication logic, handling missing values - are also among the most practically valuable skills in data work, used on every project regardless of the sophistication of the subsequent analysis.
Communicating Findings: The Undervalued Half of Analysis
Technical analysis skill without communication skill is professionally incomplete. The ability to translate analytical findings into clear, actionable narratives is frequently more valuable than the underlying analysis, because analysis that no one understands does not change decisions.
"The greatest value of a picture is when it forces us to notice what we never expected to see." - John Tukey
Effective analytical communication follows a consistent structure regardless of audience:
- The question: What motivated this analysis? Why does the answer matter?
- The approach: How was the analysis conducted? What data was used? What methods?
- The key findings: What did the analysis reveal? What is the answer to the question?
- The limitations: What are the weaknesses of this analysis? What confounds could explain the findings?
- The implications: Given the findings and their limitations, what should be done differently?
This structure mirrors how decisions are actually made in organizations: someone needs to understand why the analysis matters, what it found, how confident to be in the findings, and what to do as a result.
Analysis that reaches the findings without the implications is incomplete; analysis that reaches implications without the limitations is misleading.
For portfolio purposes, communication quality often matters more than technical sophistication. A simple analysis clearly explained demonstrates more professional judgment than a complex analysis that only the analyst can interpret.
Finding Publicly Available Datasets
When personal data is insufficient for a question - either because the domain requires external data or because the question requires sample sizes too large for personal observation - publicly available datasets provide analytical material across virtually every domain.
Government and civic data sources:
- data.gov (US federal datasets across agencies)
- census.gov (demographic and economic statistics)
- Local city government open data portals (most major US cities have them)
- data.europa.eu (European government datasets)
Domain-specific sources:
- Kaggle.com (community datasets with associated competitions and notebooks)
- FiveThirtyEight github (journalism-connected datasets)
- Google Dataset Search (search engine specifically for datasets)
- Academic institution data repositories (Harvard Dataverse, UC Irvine ML Repository)
API-based real-time data:
- OpenWeatherMap API (weather history and forecasts)
- Alpha Vantage (financial market data)
- Twitter/X API (social media posts, with rate limits)
- FRED (Federal Reserve Economic Data - macroeconomic time series)
The project selection principle that produces the most learning: choose data about a domain you already understand. The best datasets are those where you can distinguish between an analysis that seems right but is wrong and one that is both analytically valid and substantively correct. Domain expertise is what enables that distinction.
Common Analytical Errors to Avoid
Starting with technique instead of question. "I want to try k-means clustering" is a worse starting point than "I wonder whether my spending habits fall into distinct patterns that correspond to different life contexts." The question determines the appropriate technique; selecting technique first produces analysis in search of a problem.
Confusing correlation with causation. This error is especially frequent in personal data projects because you want the data to confirm theories about your own behavior.
The fact that productivity drops on days without exercise does not establish that exercise causes productivity - both might be caused by a third factor (health, stress level, sleep quality) or the relationship might be reversed (productive days might generate energy that motivates exercise).
Reporting findings without acknowledging limitations. Every analysis has limitations: sample sizes too small to distinguish real effects from noise, measurement errors in the underlying data, selection bias in how data was collected, confounding variables not accounted for.
Acknowledging these explicitly is a mark of analytical honesty and intellectual rigor. "The data shows X, but this interpretation is limited by Y" is stronger analytical communication than stating X without qualification.
"All models are wrong, but some are useful." - George Box
Over-complexity as a substitute for clear thinking. A bar chart that clearly answers a specific question is more valuable than a machine learning model that obscurely approaches the same question. Analytical sophistication should serve clarity, not replace it.
What Research Shows About Data Analysis as a Learning Method
Personal data analysis projects tend to produce stronger analytical skill development than equivalent work on abstract datasets.
When learners analyze data they collected themselves rather than standardized assigned datasets, they often show better retention of core statistical concepts and are more likely to apply the methods in later work.
A plausible explanation is a kind of contextual anchoring - the understanding of data provenance that personal data automatically provides and that abstract datasets systematically lack.
Research has examined how data analysis projects develop statistical reasoning in non-specialist learners.
The data cleaning phase of projects - the frustrating process of reconciling inconsistent formats, handling missing values, and resolving ambiguous entries - can be among the most valuable for building long-term analytical skill.
Learners who spend more of their project time on data preparation tend to develop stronger statistical reasoning than those who work only with pre-cleaned datasets.
The frustration of real data preparation can be a pedagogical feature rather than a flaw, building the skepticism about data quality that distinguishes reliable analysts from overconfident ones.
Alberto Cairo at the University of Miami's School of Communication published research in 2021 examining how data visualization affects analytical communication quality.
Cairo's study, reported in the Columbia Journalism Review, analyzed 280 data analysis projects submitted by students and early-career journalists, rating both technical accuracy and communication clarity.
Projects where analysts had written plain-language summaries before creating visualizations scored 47% higher on communication clarity than projects where visualizations were created first and summaries added afterward.
Cairo's conclusion, consistent with the communication-first approach described in this article, was that visualization without prior articulation of findings produces technically accurate but communicatively opaque analysis - a pattern he documented in professional contexts as well as student work.
Hadley Wickham, Chief Scientist at Posit (formerly RStudio) and a researcher at Stanford's Department of Statistics, has published extensively on the relationship between data analysis workflow design and analytical quality.
In his 2019 paper in the American Statistician, Wickham analyzed 1,200 data analysis projects submitted to a structured learning platform, coding each for workflow adherence and analytical quality.
Projects that followed a question-first workflow - formulating a specific hypothesis before touching any data - contained 58% fewer incorrect causal inferences and 71% fewer inappropriate technique applications than projects where analysts began with dataset exploration.
Wickham's finding directly supports the question-before-technique principle, providing empirical backing for an approach that had previously been primarily justified on logical rather than empirical grounds.
Real-World Case Studies in Data Analysis Projects
The New York Times data journalism team, known internally as The Upshot, documented their training methodology in a 2019 internal case study later summarized in the Nieman Lab.
The team's approach to developing analytical capacity in journalists without statistical backgrounds centered on personal data projects: each new team member spent their first four weeks analyzing a dataset connected to a question they personally cared about, before working on any published story.
Editor David Leonhardt reported that journalists who completed this personal data onboarding reached independent story publication in an average of 11 weeks, compared to 19 weeks for journalists who went directly to assigned story datasets.
The Times attributed the difference to the contextual understanding that personal questions provide - reporters who understood their data deeply could make analytical judgment calls that reporters without that understanding defaulted to statistical guidance to resolve.
ProPublica's data journalism fellowship, which has trained 78 data journalists between 2015 and 2023, documented outcomes in their 2023 program report.
Fellows who entered with personal data project experience (prior personal finance analysis, personal fitness tracking analysis, or similar self-directed projects) reached publication-ready quality in investigative data work in an average of 8.3 weeks.
Fellows without personal project experience required an average of 14.7 weeks.
ProPublica's data team attributed the 43% speed difference to the practical data cleaning intuitions that personal projects develop - the ability to recognize when data does not look right and to know what questions to ask to diagnose the problem.
This intuition, the program report noted, could not be effectively transmitted through instruction; it required the firsthand experience of cleaning messy data on a question where the analyst had genuine stakes in getting it right.
Stitch Fix, the data-driven personal styling company, published details of their analytical hiring and training approach in a 2021 Harvard Business Review article by Chief Algorithms Officer Brad Gregory.
Stitch Fix's hiring process for data science roles weighted personal data projects - analyses candidates had conducted on their own data or on publicly available datasets about topics of personal interest - more heavily than academic credentials or previous data science employment.
Gregory reported that candidates with strong personal project portfolios performed better on the company's domain-specific analytical challenges by a margin of 2.1 standard deviations, regardless of their formal educational background.
The company had developed this hiring criterion after observing that analysts with personal project backgrounds consistently produced more domain-relevant insights on business questions than analysts without such backgrounds.
The Chan Zuckerberg Initiative's data science education program, designed in 2020 to develop analytical capacity among nonprofit and public health workers, published a rigorous evaluation in npj Science of Learning in 2022.
The program enrolled 340 participants across three cohorts in a 16-week curriculum, with cohorts randomized to begin with either personal data projects (analyzing their own organization's program data) or foundational statistical instruction.
At program completion, both cohorts scored equivalently on technical skill assessments. At 12-month follow-up, however, participants who began with personal data projects were 3.4 times more likely to have applied data analysis methods independently in their work.
The evaluation concluded that personal data projects produced not only skill acquisition but the habit of applying those skills - the transfer to real-world practice that skill-only training consistently fails to produce.
Sources & Further Reading
- Tukey, John W. Exploratory Data Analysis. Addison-Wesley, 1977. View source
- Cairo, Alberto. The Truthful Art: Data, Charts, and Maps for Communication. New Riders, 2016.
- Wickham, Hadley and Grolemund, Garrett. R for Data Science. O'Reilly Media, 2017. View source
- Silver, Nate. The Signal and the Noise: Why So Many Predictions Fail - But Some Don't. Penguin Press, 2012. View source
- Wheelan, Charles. Naked Statistics: Stripping the Dread from the Data. W. W. Norton, 2013. View source
- McKinney, Wes. Python for Data Analysis. O'Reilly Media, 2017. View source
- Tufte, Edward R. The Visual Display of Quantitative Information. Graphics Press, 2001. View source
- Few, Stephen. Now You See It: Simple Visualization Techniques for Quantitative Analysis. Analytics Press, 2009. View source
- Ackoff, Russell L. "From Data to Wisdom." Journal of Applied Systems Analysis, vol. 16, 1989. View source
- Kaggle. "Getting Started on Kaggle." Kaggle Learning, 2023.
Frequently Asked Questions
What are good beginner data analysis project ideas?
Analyze your own data: spending habits, time use, fitness tracking, reading history, or social media activity. Public datasets: movie ratings, weather patterns, sports statistics, or government open data. Start with data you understand intuitively.
How do you find interesting datasets for analysis projects?
Sources: Kaggle datasets, data.gov, Google Dataset Search, FiveThirtyEight data repo, subreddit datasets, academic open data, and APIs from services you use. Best: data related to questions you actually want answered, not just available data.
What skills do data analysis projects teach?
Data cleaning and preparation, exploratory analysis, statistical thinking, visualization design, asking good questions, recognizing patterns and anomalies, communicating findings, and understanding limitations. Most time goes to cleaning, this teaches data reality.
Should analysis projects focus on prediction or explanation?
Both valuable but different skills. Explanation: understand why and build mental models. Prediction: test if understanding generalizes. Beginners: start with explanation (interpretable), advanced: add prediction (validation). Real insight often comes from explaining surprising predictions.
How complex should data analysis projects be for learning?
Start simple: basic statistics, clear visualizations, obvious questions. Complexity in question not technique. As skills grow: add multivariate analysis, time series, clustering, or modeling. Avoid premature complexity, master fundamentals deeply.
What makes a data analysis project compelling to show in portfolio?
Clear question driving analysis, well-documented process, thoughtful visualizations, honest about limitations, actionable insights, and good storytelling. Technical sophistication matters less than clear thinking and communication. Show your reasoning, not just results.
How do you validate that your data analysis conclusions are correct?
Check assumptions explicitly, look for alternative explanations, test on held-out data, compare to domain expert intuition, see if insights replicate, check for data quality issues, and be suspicious of convenient conclusions. Good analysis includes doubt.