Renewable energy is electricity and heat generated from sources that replenish naturally on human timescales - sunlight, wind, flowing water, geothermal heat, and biological matter - as distinct from fossil fuels, which are the fossilized remains of organic material deposited over hundreds of millions of years and cannot be replenished after use.
The distinction matters because burning fossil fuels releases carbon dioxide that was removed from the atmosphere over geological time, raising atmospheric CO2 concentrations at a rate the climate system cannot absorb without significant warming.
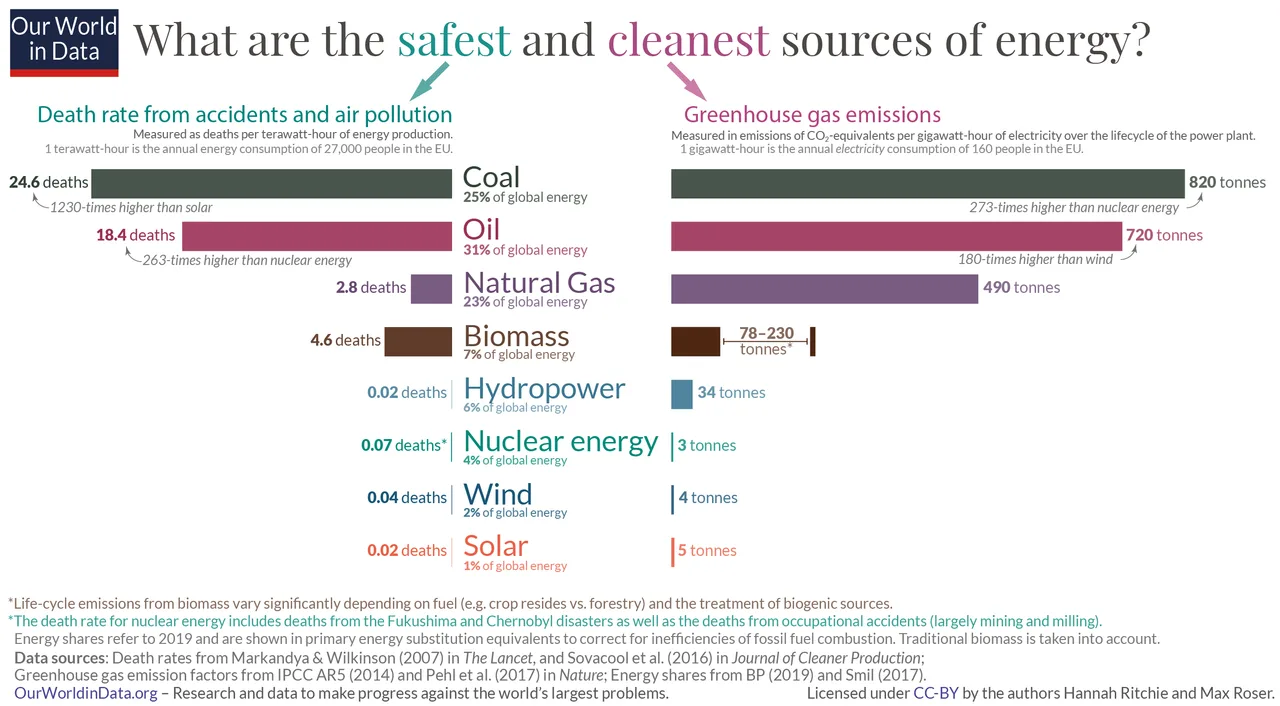
The case for renewable energy is no longer primarily moral or environmental in the abstract: it has become economic. The cost of solar photovoltaic electricity has fallen by more than 99% since 1976. Wind energy costs have fallen by roughly 70% since 2010.
In most of the world, building new wind or solar capacity is now cheaper than operating existing fossil fuel plants, let alone building new ones.
The transition to renewable energy is underway - but it is not yet happening fast enough to meet international climate targets, and the technical, economic, and political challenges of completing that transition are both real and complex.
How Solar Photovoltaics Actually Work
Solar photovoltaic (PV) cells convert sunlight directly into electricity through the photovoltaic effect, first described by Edmond Becquerel in 1839 and underpinned by the same light-quantum principle Albert Einstein used to explain the related photoelectric effect in 1905 (for which he received the 1921 Nobel Prize in Physics).
When photons of sufficient energy strike a semiconductor material - most commonly crystalline silicon - they dislodge electrons from their atomic bonds, creating an electron-hole pair.
A built-in electric field at the junction between differently doped layers of silicon (p-type and n-type) pushes these charges in opposite directions, producing a direct current that can be converted to alternating current via an inverter and fed to the grid.
The theoretical maximum efficiency for a single-junction silicon cell under the standard solar spectrum is 33.7%, known as the Shockley-Queisser limit, derived by William Shockley and Hans-Joachim Queisser in 1961.
This limit exists because photons with energy below the semiconductor's bandgap pass through unabsorbed, while photons with energy above the bandgap deposit the excess as heat. Commercial monocrystalline silicon panels typically operate at 20-23% efficiency.
To exceed the Shockley-Queisser limit, researchers have developed multijunction cells that stack multiple semiconductors with different bandgaps, each absorbing a different portion of the solar spectrum. The highest verified efficiency for any solar cell (under concentrated light) now exceeds 47%.
Standard commercial tandem cells have reached approximately 33.9% efficiency under one-sun conditions as of 2024.
Perovskite materials - a class of crystal structure with the formula ABX3 - have attracted enormous research attention since their photovoltaic use was demonstrated in 2009. Their efficiency has climbed from 3.8% in 2009 to over 26% for single-junction perovskite cells in less than two decades.
The challenge is durability: perovskites degrade with moisture, oxygen, and heat, and many formulations contain lead. Encapsulation and compositional engineering are active research frontiers that could eventually make perovskite-silicon tandems the dominant commercial technology.
The cost trajectory of solar has been governed by Wright's Law (the learning rate): for every doubling of cumulative installed capacity, the cost of solar modules has declined by approximately 20-25%.
This relationship has held across more than five doublings since the 1970s, producing a cost reduction of over 99% in solar module prices from roughly $100 per watt in 1976 to under $0.20 per watt in 2023.
The levelized cost of energy (LCOE) from utility-scale solar in favorable locations now falls below $0.02 per kilowatt-hour - cheaper than any fossil fuel plant, new or existing.
"The price of solar panels has dropped from $106 per watt in 1976 to less than $0.20 per watt today. Nothing in the history of energy markets has fallen so fast."
- International Energy Agency, World Energy Outlook 2023
Wind Energy: The Betz Limit and the Power of Scale
The Betz limit, derived by German physicist Albert Betz in 1919, states that no wind turbine can capture more than 59.3% of the kinetic energy in the wind passing through its swept area. This is a fundamental physical constraint, not a technological limitation.
The derivation rests on conservation of momentum. A wind turbine works by slowing the wind - extracting kinetic energy from moving air. But if the turbine slowed the wind to zero, the air would stop moving through the rotor entirely and no energy would be extracted.
The optimum is reached when the wind behind the turbine is slowed to one-third of its upstream speed, at which point the turbine extracts 16/27 - approximately 59.3% - of the wind's kinetic energy. Modern large wind turbines operate at 45-50% efficiency, roughly 75-85% of the theoretical maximum.
The power available in wind scales with the cube of wind speed: doubling wind speed multiplies available power by eight. This is why offshore wind, where sustained winds are typically 20-30% faster than onshore, contains roughly double the usable power density.
It also explains why the tallest turbines - with rotors reaching higher into faster, steadier winds - have seen dramatic increases in output. The world's largest offshore turbines now have rotor diameters exceeding 230 meters and rated capacities of 14-22 megawatts each.
A single such turbine can generate enough electricity to power several thousand homes.
A typical onshore wind turbine has a capacity factor (the ratio of actual annual energy output to theoretical maximum at rated power) of 25-40%, depending on site wind resources. Offshore wind turbines achieve capacity factors of 40-60%.
Wind energy's central challenge is intermittency: wind does not blow at constant speed, and periods of low wind can last days.
Grid operators must balance supply and demand in real time; when the wind does not blow, other sources must compensate.
The Duck Curve: Grid Integration Challenge
The duck curve is a graph of net electricity demand on the grid over the course of a day - total demand minus solar generation output.
When plotted for a day with high solar generation (such as a spring afternoon in California), the net demand curve resembles the profile of a duck: a belly that sags mid-day (when solar output is high and net demand is low) and a steep neck that rises sharply in the evening (when solar output drops as the sun sets but residential demand peaks as people return home).
The California Independent System Operator (CAISO) published the original duck curve analysis in 2013, projecting the challenge that would emerge as solar penetration increased.
By the mid-2020s, California regularly experiences the curve in its most dramatic form: negative net load in the middle of sunny days (more solar than can be used even at minimum demand) followed by the steepest evening ramp in the grid's history - sometimes 10,000-15,000 megawatts of additional generation required within a three-hour window.
The duck curve creates two distinct problems:
The mid-day surplus: When solar generation exceeds demand, operators must curtail solar (waste clean energy), pay neighboring grids to take the surplus, or find flexible loads to absorb it.
The evening ramp: Fast-responding generation must rapidly fill the gap when solar drops. Gas peaker plants have historically filled this role, but they emit carbon and their economics are increasingly strained as solar and storage costs fall.
Solutions include battery storage (charge during mid-day surplus, discharge during evening peak), demand response (shifting flexible loads like electric vehicle charging and water heating to solar hours), long-distance transmission (sharing solar across time zones), and improving solar-plus-storage economics.
The duck curve is not unique to California; it will appear in any grid that reaches high solar penetration.
Hydropower: Renewable but Not Without Costs
Hydropower - electricity generated from falling or flowing water - is the world's largest source of renewable electricity, providing approximately 16% of global electricity generation and 60% of renewable electricity.
Its advantages are significant: zero fuel cost, long asset lifetimes (50-100 years), dispatchability (output can be controlled in real time), and low operational emissions. Large dams also provide flood control, irrigation water, and drinking water supplies.
However, large hydropower dams impose serious environmental and social costs that distinguish them from wind and solar.
Ecological disruption is severe. Dams block river connectivity, preventing fish migration.
Pacific salmon populations in the American Northwest have declined dramatically since the construction of Columbia River dams in the 20th century; the four Snake River dams are under active consideration for removal specifically to restore salmon runs.
Dams change water temperature, oxygen levels, and sediment transport downstream, fundamentally altering river ecosystems for hundreds of kilometers.
Sediment trapping is a long-term sustainability problem. Rivers carry sediment from erosion; dams trap it, reducing reservoir capacity over decades and starving downstream areas of material that builds deltas and replenishes beaches.
The Nile Delta is actively sinking and eroding in part because the Aswan High Dam retains 98% of the Nile's natural sediment load.
Social displacement has been massive. The Three Gorges Dam on the Yangtze River - the world's largest power plant by installed capacity at 22,500 megawatts - required the relocation of approximately 1.3 million people from flooded towns and villages.
Global estimates suggest large dams have displaced 40-80 million people over the 20th century.
Flooded vegetation decomposes anaerobically in tropical reservoirs, producing methane - a potent greenhouse gas. Some tropical reservoirs have lifecycle greenhouse gas emissions comparable to coal plants, largely negating their climate benefit.
| Renewable Technology | Capacity Factor (typical) | Dispatchable | Primary Limitation |
|---|---|---|---|
| Utility-scale solar PV | 15-30% (onshore) | No (without storage) | Intermittent, duck curve |
| Onshore wind | 25-40% | No | Intermittent |
| Offshore wind | 40-60% | No | Intermittent |
| Hydropower (large) | 30-60% | Yes | Environmental costs, geography |
| Geothermal | 80-95% | Yes | Limited geography |
| Biomass | 60-80% | Yes | Land use, sustainability concerns |
| Solar + 4-hour battery | Variable | Partial | Storage duration limited |
The Energy Storage Challenge
Electricity is uniquely difficult to store at scale. Unlike natural gas or coal, electricity must be consumed the instant it is generated or converted into another form of energy.
The grid must balance supply and demand in real time, to within a fraction of a percent, or frequency deviates from its standard (50 or 60 Hz depending on country) and equipment is damaged or blackouts occur.
At present, approximately 90% of global utility-scale electrical storage capacity is pumped hydropower: water is pumped from a lower reservoir to an upper reservoir when electricity is cheap or surplus, then released through turbines when needed.
Pumped hydro has an energy efficiency of around 70-80%, responds quickly, and can be built at enormous scale. Its limitations are geographic - topography must support two reservoirs at different elevations.
Lithium-ion batteries have become the dominant new storage technology. Their cost has fallen by approximately 97% since 1991, following a learning rate of about 18% per doubling of production. Grid-scale lithium-ion systems now cost roughly $150-250 per kilowatt-hour of storage capacity, down from over $1,000 in 2010.
They respond almost instantaneously (valuable for frequency regulation), can be sited anywhere, and pair naturally with solar and wind installations.
Their limitations include degradation over charge cycles (typically 2,000-4,000 full cycles) and a modest energy density relative to liquid fuels.
For longer-duration storage (multiple days to seasonal), alternatives are under development. Iron-air batteries use the rusting of iron (oxidation) to release energy and the reverse reaction to store it.
Iron is abundant, non-toxic, and cheap; iron-air cells could achieve costs around $20 per kilowatt-hour for long-duration storage - a fraction of lithium-ion. Form Energy has demonstrated multi-day iron-air systems at commercial scale.
Green hydrogen - produced by electrolysis powered by renewable electricity - offers the prospect of seasonal storage and long-distance energy transport.
Its round-trip efficiency (electricity to hydrogen back to electricity) is currently 25-40%, making it expensive for short-duration storage but potentially valuable for decarbonizing sectors that cannot easily electrify, such as shipping, aviation, and high-temperature industrial processes.
The Critical Minerals Bottleneck
The clean energy transition requires massive quantities of specific minerals whose supply chains are geographically concentrated, subject to geopolitical risk, and associated with significant environmental and human rights concerns.
The International Energy Agency's 2021 report "The Role of Critical Minerals in Clean Energy Transitions" identified this as a central challenge.
Lithium is essential for lithium-ion batteries in electric vehicles and grid storage. The Lithium Triangle - Chile, Argentina, and Bolivia - contains more than half the world's lithium reserves. Battery demand for lithium is projected to increase by up to 40 times by 2040 under a net-zero scenario.
Cobalt is used in cathode materials for many lithium-ion battery chemistries. Approximately 70% of cobalt production comes from the Democratic Republic of Congo, where artisanal mining operations have been associated with child labor, hazardous conditions, and environmental damage.
Battery manufacturers are actively developing low-cobalt and cobalt-free chemistries - lithium iron phosphate (LFP) is the leading cobalt-free option.
Rare earth elements (particularly neodymium, praseodymium, and dysprosium) are used in permanent magnets for wind turbine generators and electric vehicle motors. China controls approximately 85% of rare earth refining capacity, raising supply security concerns for countries attempting to build domestic clean energy industries.
Copper demand for electrification - grid wiring, motor windings, offshore wind cables - is projected to require a near-doubling of current production by 2040.
The environmental costs of mineral extraction mean that a clean energy transition built on poorly governed mining could create new environmental injustices even while reducing carbon emissions.
Circular economy strategies (battery recycling, material recovery) are essential for long-term sustainability but currently handle a small fraction of the materials entering the system.
How Fast Is the Energy Transition Happening?
The energy transition is proceeding faster than almost anyone predicted a decade ago, but not fast enough to meet international climate targets.
On the positive side, renewables have achieved extraordinary market penetration in new electricity generation. The International Energy Agency's World Energy Outlook 2023 reported that renewable energy sources accounted for approximately 90% of all new electricity generation capacity added globally in 2023.
Solar alone added more capacity than any other energy technology in history. In 2023, global solar manufacturing capacity exceeded 500 gigawatts per year - more than the entire installed solar base just five years earlier.
New solar projects in the Middle East and Latin America have signed power purchase agreements at prices below $0.02 per kilowatt-hour - compared to natural gas at $0.05-0.10 and coal at $0.06-0.15 in most markets.
However, these gains are almost entirely in the electricity sector, which represents only about 20% of total global energy consumption. The remaining 80% - heating, transportation, industrial processes, and cooking - still runs overwhelmingly on fossil fuels.
Despite the renewable electricity revolution, total global energy-related carbon dioxide emissions reached record highs in 2022-2023, because economic growth and expanding energy access in developing countries have increased total energy demand faster than renewables have replaced fossil fuels.
Coal, oil, and natural gas together still supply approximately 80% of global primary energy.
The IEA's Net Zero by 2050 scenario requires no new fossil fuel development beyond projects already approved, the retirement of many existing fossil fuel assets before the end of their natural life, and a near-complete transformation of the energy system within 25 years.
No historical energy transition has proceeded at this speed.
Energy Justice and the Developing World
Energy justice - ensuring that the transition provides affordable, reliable energy to the 700 million people who currently lack electricity access, primarily in sub-Saharan Africa, without condemning them to expensive imported clean technology or continued fossil fuel dependency - is one of the defining political and moral challenges of the coming decades.
The countries with the greatest unmet energy need are also among the most vulnerable to climate change. They have contributed the least to historical emissions but face the greatest risks from rising temperatures, droughts, floods, and sea level rise.
Requiring them to leapfrog directly to renewable energy systems - which require significant upfront capital - without adequate financing support from wealthy countries who built their prosperity on fossil fuels represents a genuine injustice.
The falling cost of distributed solar PV, combined with mobile payment systems, has enabled pay-as-you-go solar home systems to reach rural households in sub-Saharan Africa and South Asia that will never be connected to a centralized grid.
Companies like M-KOPA have provided solar home systems to several million households, demonstrating that distributed renewable energy can serve populations that centralized fossil fuel infrastructure never reached.
This is one of the most promising practical examples of how the energy transition can expand access rather than simply substitute one energy system for another in wealthy countries.
Understanding renewable energy requires holding two realities simultaneously: a technology revolution that has made clean electricity dramatically cheaper and more accessible than anyone expected, and a pace of system-wide transition that remains inadequate to the scale of the climate challenge.
The physics, economics, and engineering are increasingly favorable. The remaining obstacles are largely political, financial, and institutional - which is to say, the kind of obstacles that human societies can, in principle, choose to overcome.
Frequently Asked Questions
How does solar photovoltaic power actually work, and how efficient can it get?
Solar photovoltaic (PV) cells convert sunlight directly into electricity through the photovoltaic effect, first described by Edmond Becquerel in 1839 and underpinned by the same light-quantum principle Albert Einstein used to explain the related photoelectric effect in 1905 (for which he received the 1921 Nobel Prize in Physics). When photons of sufficient energy strike a semiconductor material, most commonly crystalline silicon, they dislodge electrons from their atomic bonds, creating an electron-hole pair. A built-in electric field at the junction between differently doped layers of silicon (p-type and n-type) pushes these charges in opposite directions, producing a direct current.The theoretical maximum efficiency for a single-junction silicon cell under the AM1.5 standard solar spectrum is 33.7%, known as the Shockley-Queisser limit, derived in 1961. This limit exists because photons with energy below the semiconductor’s bandgap pass through unabsorbed, while photons with energy above the bandgap deposit the excess as heat rather than electrical energy. Commercial monocrystalline silicon panels typically operate at 20-23% efficiency; polycrystalline at 15-17%.To exceed the Shockley-Queisser limit, researchers have developed multijunction cells that stack multiple semiconductors with different bandgaps, each absorbing a different portion of the spectrum. The highest verified efficiency for any solar cell (under concentrated light) now exceeds 47%, achieved with perovskite-silicon tandem architectures. Standard commercial tandem cells have reached 33.9% efficiency under one-sun conditions as of 2024.Perovskite materials, a class of crystal structure with the formula ABX3, have attracted enormous research attention since their photovoltaic use was demonstrated in 2009. Their efficiency has climbed from 3.8% in 2009 to over 26% for single-junction perovskite cells in less than two decades. The challenge is durability: perovskites degrade with moisture, oxygen, and heat, and many formulations contain lead. Encapsulation and compositional engineering are active research frontiers.The cost trajectory of solar has been governed by Wright’s Law (the learning rate): for every doubling of cumulative installed capacity, the cost of solar modules has declined by approximately 20-25%. This relationship has held across more than five doublings since the 1970s, producing a cost reduction of over 99% in solar module prices from roughly \(100 per watt in 1976 to under \)0.20 per watt in 2023. The levelized cost of energy (LCOE) from utility-scale solar in favorable locations now falls below $0.02 per kilowatt-hour, cheaper than any fossil fuel plant, new or existing.
What is the Betz limit, and why can't wind turbines be 100% efficient?
The Betz limit, derived by German physicist Albert Betz in 1919, states that no wind turbine can capture more than 59.3% of the kinetic energy in the wind passing through its swept area. This is a fundamental physical constraint, not a technological limitation that engineering can overcome.The derivation is based on conservation of momentum and energy. A wind turbine works by slowing the wind, extracting kinetic energy from moving air. But if the turbine slowed the wind to zero, the air would stop moving through the rotor entirely and no energy would be extracted. The optimum is reached when the wind behind the turbine is slowed to one-third of its upstream speed. At this point the turbine extracts the maximum fraction of the wind’s kinetic energy: 16⁄27, or approximately 59.3%.Modern large wind turbines operate at 45-50% efficiency, roughly 75-85% of the Betz limit, which represents outstanding engineering. A typical onshore wind turbine has a capacity factor (the ratio of actual annual energy output to theoretical maximum output at rated power, running continuously) of 25-40%, depending on site wind resources. Offshore wind turbines, where winds are stronger and more consistent, achieve capacity factors of 40-60%.Wind energy’s central challenge is intermittency: wind does not blow at constant speed, and periods of low wind can last days. Grid operators must balance supply and demand in real time; when the wind does not blow, other sources must compensate. This requires either flexible backup generation (gas peakers, hydropower), energy storage, demand response, or geographic diversification across a wide grid area where wind conditions are not correlated. Integrating variable renewables at high grid penetrations requires significant investment in these complementary systems, which is the core challenge of the energy transition.The power available in wind scales with the cube of wind speed: doubling wind speed multiplies available power by eight. This is why offshore wind, where sustained winds are typically 20-30% faster than onshore, contains roughly double the usable power density. It also explains why the tallest turbines, with rotors reaching higher into faster, steadier winds, have seen dramatic increases in output. The world’s largest offshore turbines now have rotor diameters exceeding 230 meters and rated capacities of 14-22 megawatts each.
What is the duck curve, and why does it matter for the energy transition?
The duck curve is a graph of net electricity demand on the grid over the course of a day, the total demand minus the output of solar generation. When plotted for a day with high solar generation (such as a spring afternoon in California), the net demand curve resembles the profile of a duck: a belly that sags mid-day (when solar output is high and net demand is low) and a steep neck that rises sharply in the evening (when solar output drops as the sun sets, but residential demand peaks as people return home).The California Independent System Operator (CAISO) published the original duck curve analysis in 2013, projecting the challenge that would emerge as solar penetration increased. By the mid-2020s, California regularly experiences the curve in its most dramatic form: negative net load in the middle of sunny days (more solar than can be used even at minimum demand) followed by the steepest evening ramp in the grid’s history, sometimes 10,000-15,000 megawatts of additional generation required within a three-hour window.The duck curve creates two distinct problems. First, the mid-day surplus: when solar generation exceeds demand, operators must curtail solar (waste clean energy), pay other grids to take the surplus, or have flexible loads absorb it. Second, the evening ramp: fast-responding generation must rapidly fill the gap when solar drops. Gas peaker plants, which can start quickly but are expensive to operate, have historically filled this role, but they emit carbon and their economics are increasingly strained.Solutions include: battery storage (charge during mid-day surplus, discharge during evening peak), demand response (shifting flexible loads like electric vehicle charging and water heating to solar hours), long-distance transmission (sharing solar across time zones), and improving solar-plus-storage economics to make dispatchable solar competitive. The duck curve is not a problem unique to California; it will appear in any grid that reaches high solar penetration, making storage and grid flexibility the central infrastructure challenge of the energy transition rather than simply building more solar panels.
Why does hydropower have environmental costs despite being renewable?
Hydropower, electricity generated from falling or flowing water, is the world’s largest source of renewable electricity, providing approximately 16% of global electricity generation and 60% of renewable electricity. Its advantages are significant: zero fuel cost, long asset lifetimes (50-100 years), dispatchability (output can be controlled in real time, unlike solar and wind), and low operational emissions. Large dams also provide flood control, irrigation water, and drinking water supplies.However, large hydropower dams impose serious environmental and social costs that distinguish them from wind and solar.Ecological disruption is severe. Dams block river connectivity, preventing fish migration. Pacific salmon populations in the American Northwest have declined dramatically since the construction of Columbia River dams in the 20th century; four Snake River dams are under active consideration for removal specifically to restore salmon runs. Dams change water temperature, oxygen levels, and sediment transport downstream, fundamentally altering river ecosystems for hundreds of kilometers.Sediment trapping is a long-term sustainability problem. Rivers carry sediment from erosion; dams trap this sediment, reducing reservoir capacity over decades and starving downstream areas of material that builds deltas and replenishes beaches. The Nile Delta is actively sinking and eroding in part because the Aswan High Dam retains 98% of the Nile’s natural sediment load.Social displacement has been massive. The Three Gorges Dam on the Yangtze River, the world’s largest power plant by installed capacity at 22,500 megawatts, required the relocation of approximately 1.3 million people from flooded towns and villages. Global estimates suggest large dams have displaced 40-80 million people over the 20th century.Flooded vegetation decomposes anaerobically in tropical reservoirs, producing methane, a potent greenhouse gas. Some tropical reservoirs have lifecycle greenhouse gas emissions comparable to coal plants, largely negating their climate benefit, though this varies enormously by geography and reservoir management.These costs explain why most remaining hydropower potential is in regions where the environmental and social trade-offs are most contested, particularly in Amazonia, the Congo Basin, and the Himalayan river systems.
What is the energy storage challenge, and what are the leading solutions?
Electricity is uniquely difficult to store at scale. Unlike natural gas or coal, which can sit in storage indefinitely, electricity must be consumed the instant it is generated or converted into another form of energy. The grid must balance supply and demand in real time, to within a fraction of a percent, or frequency deviates from 50⁄60 Hz and equipment is damaged or blackouts occur.At present, approximately 90% of global utility-scale electrical storage capacity is pumped hydropower: water is pumped from a lower reservoir to an upper reservoir when electricity is cheap or surplus, then released through turbines when electricity is needed. Pumped hydro has an energy efficiency of around 70-80%, responds quickly, and can be built at enormous scale. Its limitations are geographic, you need topography to support two reservoirs at different elevations, and it cannot be built everywhere.Lithium-ion batteries have become the dominant new storage technology. Their cost has fallen by approximately 97% since 1991, following a learning rate of about 18% per doubling of production. Grid-scale lithium-ion systems now cost roughly \(150-250 per kilowatt-hour of storage capacity, down from over \)1,000 in 2010. They respond almost instantaneously (valuable for frequency regulation), can be sited anywhere, and pair naturally with solar and wind installations. Their limitations include degradation over charge cycles (typically 2,000-4,000 full cycles), the need for thermal management to prevent fires, and a relatively modest energy density compared to liquid fuels.For longer-duration storage (multiple days to seasonal), alternatives are under development. Iron-air batteries use the rusting of iron (oxidation) to release energy and the reverse reaction (reduction) to store it. Iron is abundant, non-toxic, and cheap; iron-air cells can achieve costs of approximately $20 per kilowatt-hour for long-duration storage, a fraction of lithium-ion. Form Energy has demonstrated multi-day iron-air systems at commercial scale.Green hydrogen, produced by electrolysis powered by renewable electricity, offers the prospect of seasonal storage and long-distance energy transport. Its round-trip efficiency (electricity to hydrogen back to electricity) is currently 25-40%, making it expensive for short-duration storage but potentially valuable for decarbonizing sectors that cannot easily electrify, such as shipping, aviation, and high-temperature industrial processes.The levelized cost of storage (LCOS), analogous to LCOE for generation, is the metric for comparing storage technologies, accounting for capital cost, efficiency losses, and cycle life across the full operating lifetime of the asset.
What is the critical minerals bottleneck in the energy transition?
The clean energy transition requires massive quantities of specific minerals whose supply chains are geographically concentrated, subject to geopolitical risk, and associated with significant environmental and human rights concerns. The International Energy Agency’s 2021 report ‘The Role of Critical Minerals in Clean Energy Transitions’ identified this as one of the central challenges of the energy transition.Lithium is essential for lithium-ion batteries in electric vehicles and grid storage. The Lithium Triangle, Chile, Argentina, and Bolivia, contains more than half the world’s lithium reserves; Chile and Australia currently dominate production. Battery demand for lithium is projected to increase by up to 40 times by 2040 under a net-zero scenario.Cobalt is used in cathode materials for many lithium-ion battery chemistries. Approximately 70% of cobalt production comes from the Democratic Republic of Congo, where artisanal mining operations have been associated with child labor, hazardous conditions, and environmental damage. Battery manufacturers are actively developing low-cobalt and cobalt-free chemistries (LFP, lithium iron phosphate, is the leading cobalt-free option) partly to reduce this exposure.Nickel, manganese, and copper are also required in large quantities. Copper demand for electrification, grid wiring, motor windings, offshore wind cables, is projected to require a near-doubling of current production by 2040.Rare earth elements (particularly neodymium, praseodymium, and dysprosium) are used in permanent magnets for wind turbine generators and electric vehicle motors. China controls approximately 85% of rare earth refining capacity, raising supply security concerns for countries attempting to build domestic clean energy industries.The environmental costs of mineral extraction, habitat destruction, water use, tailings management, local air and water pollution, mean that a clean energy transition built on poorly governed mining could create new environmental injustices even while reducing carbon emissions. Circular economy strategies (battery recycling, material recovery) are essential for long-term sustainability but currently handle a small fraction of the materials entering the system.
How fast is the energy transition actually happening, and what does IEA data show?
The energy transition is proceeding faster than almost anyone predicted a decade ago, but not fast enough to meet international climate targets, a tension at the heart of current energy policy.On the positive side, renewables have achieved extraordinary market penetration in new electricity generation. The International Energy Agency’s World Energy Outlook 2023 reported that renewable energy sources, primarily solar and wind, accounted for approximately 90% of all new electricity generation capacity added globally in 2023. Solar alone added more capacity than any other energy technology in history. In 2023, global solar manufacturing capacity exceeded 500 gigawatts per year, more than the entire installed solar base just five years earlier.Costs have collapsed to the point where solar and wind are the cheapest sources of new electricity generation in most of the world. New solar projects in the Middle East and Latin America have signed power purchase agreements at prices below \(0.02 per kilowatt-hour, compared to natural gas at \)0.05-0.10 and coal at $0.06-0.15 in most markets.However, these gains are almost entirely in the electricity sector, which represents only about 20% of total global energy consumption. The remaining 80%, heating, transportation, industrial processes, and cooking, still runs overwhelmingly on fossil fuels. The IEA’s data show that despite the renewable electricity revolution, total global energy-related carbon dioxide emissions reached record highs in 2022-2023, because economic growth and expanding energy access in developing countries have increased total energy demand faster than renewables have replaced fossil fuels in electricity.Coal, oil, and natural gas together still supply approximately 80% of global primary energy. The IEA’s Net Zero by 2050 scenario requires no new fossil fuel development beyond projects already approved, the retirement of many existing fossil fuel assets before the end of their natural life, and a near-complete transformation of the energy system within 25 years. No historical energy transition has proceeded at this speed.Energy justice, ensuring that the transition provides affordable, reliable energy to the 700 million people who currently lack electricity access, primarily in sub-Saharan Africa, without condemning them to expensive imported clean technology or continued fossil fuel dependency, is one of the defining political and moral challenges of the coming decades.