The history of technology is littered with innovations that should have succeeded but didn't, and innovations that nobody expected to matter but transformed civilization. The fax machine was invented in 1843, thirty-three years before the telephone, yet it didn't achieve mass adoption until the 1980s.
The electric car was commercially available in the 1890s and outsold gasoline cars in several American cities, then virtually disappeared for a century before re-emerging in the 2010s.
The internet existed in various forms from the late 1960s but didn't become a mainstream technology until the mid-1990s, when the World Wide Web provided an accessible interface for non-technical users.
Meanwhile, technologies like the smartphone went from zero to near-universal adoption in wealthy nations within barely a decade, one of the fastest technology diffusions in human history.
These patterns are not random. Technology adoption follows recognizable dynamics that have been studied, modeled, and tested across hundreds of innovations in dozens of countries over more than six decades of research.
The patterns are not deterministic; no model can predict with certainty whether a specific technology will succeed or fail.
But the dynamics are systematic enough that understanding them transforms how you think about innovation, competition, policy, and social change.
This examination traces the full process of technology adoption, from the characteristics that determine whether an innovation has the potential to spread, through the social dynamics that govern how innovations move through populations, to the strategic and organizational challenges of crossing the infamous "chasm" between early adopters and the mainstream market.
The Diffusion of Innovations: Rogers's Foundational Framework
The study of technology adoption effectively began with Everett Rogers, a communication scholar at Iowa State University who published Diffusion of Innovations in 1962. Rogers did not study electronic technologies; his original research focused on the adoption of hybrid corn seed among Iowa farmers in the 1930s and 1940s.
But the patterns he identified proved remarkably generalizable across virtually all types of innovation, from agricultural practices to medical technologies to consumer electronics to organizational processes.
"The rate of adoption is the relative speed with which an innovation is adopted by members of a social system." - Everett M. Rogers
The S-Curve of Adoption
Rogers's most fundamental observation was that technology adoption follows an S-shaped curve when plotted over time. The curve begins slowly, as only a small number of innovators try the new technology. It then accelerates as early adopters and then the early majority adopt, producing a steep rise.
Finally, it decelerates as the remaining late majority and laggards adopt, producing a tapering off that approaches but may never reach 100% adoption.
The mathematical shape of this curve is a logistic function, the same function that describes bacterial growth in a petri dish, the spread of epidemics through populations, and many other processes involving positive feedback constrained by finite resources.
The analogy to epidemics is particularly apt: technology adoption spreads through social networks in much the same way that diseases spread through physical contact networks.
Each adopter "infects" their social contacts with awareness of and interest in the technology, creating a cascading process that accelerates until the pool of potential new adopters begins to run dry.
The S-curve has been confirmed in studies of virtually every major technology adoption in the 20th and 21st centuries. Television adoption in the United States followed an S-curve from roughly 1948 to 1960. Mobile phone adoption followed an S-curve from roughly 1990 to 2010.
Internet adoption followed an S-curve from roughly 1995 to 2015. The specific timescales vary enormously, from just a few years for some consumer technologies to decades or even centuries for some industrial or institutional innovations, but the underlying shape is remarkably consistent.
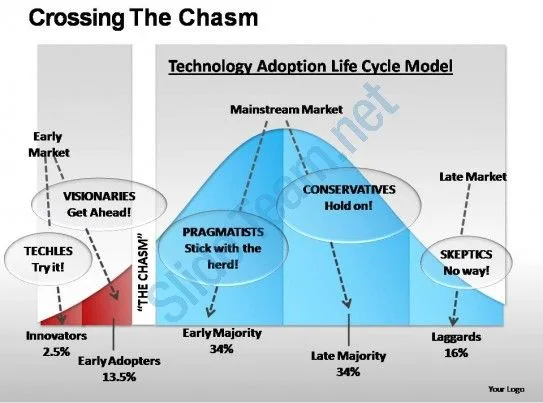
The Five Adopter Categories
Rogers divided the population into five adopter categories based on their timing of adoption, each with distinct characteristics and motivations.
Innovators (2.5% of the population) are the first to adopt a new technology. They are typically technology enthusiasts who derive satisfaction from experimenting with new things.
Innovators have high tolerance for risk and imperfection; they are willing to deal with bugs, poor documentation, missing features, and the absence of social proof.
They often have technical expertise that allows them to work around problems that would defeat less knowledgeable users.
Innovators play a crucial role in the adoption process not because of their numbers but because they provide the initial testing, feedback, and social proof that allows the next group to adopt.
In the technology industry, innovators are the people who install beta software, buy first-generation hardware, contribute to open-source projects, and attend developer conferences.
They adopted the internet before the World Wide Web existed, bought the first clunky smartphones before the iPhone, and experimented with cryptocurrency before most people had heard of Bitcoin.
Their adoption is driven by intrinsic interest in the technology itself, not by practical need or social pressure.
Early adopters (13.5%) adopt after innovators but before the majority. Unlike innovators, who are motivated primarily by technological curiosity, early adopters are motivated by strategic advantage.
They see the potential for a new technology to solve real problems or create real opportunities, and they adopt it to gain a competitive edge.
Early adopters are typically well-connected opinion leaders within their social networks, and their adoption decisions carry significant influence.
In business contexts, early adopters are the executives who champion new enterprise software, the marketing directors who experiment with new advertising platforms, and the manufacturers who invest in unproven automation technologies. They do not wait for social proof; they create it.
Their willingness to take calculated risks and share their experiences publicly makes them the most critical group for technology diffusion because their endorsement provides the credibility that the early majority requires.
The early majority (34%) adopts once the technology has been proven by early adopters and a reasonable ecosystem of support, documentation, and complementary products exists. The early majority is pragmatic: they want technology that works, that solves concrete problems, and that doesn't require excessive effort to implement.
They are influenced by the experiences of early adopters in their network and by evidence of growing momentum, but they are not willing to bear the costs and risks of early adoption.
The early majority's adoption is driven primarily by practical need and peer influence. They adopt new accounting software when their peers report that it saves time and reduces errors. They switch to a new communication platform when enough of their contacts have already switched to make staying on the old platform costly.
Their adoption follows rather than leads, but their sheer numbers (34% of the population) make their adoption the phase during which a technology transitions from niche to mainstream.
The late majority (34%) adopts only after most of their peers have already done so. They are skeptical of new technology, sensitive to risk, and typically lack the resources or confidence to navigate the uncertainties of earlier adoption.
The late majority often adopts not because they are enthusiastic about the new technology but because the old technology is no longer adequately supported, because social or professional pressure makes non-adoption costly, or because the new technology has become so ubiquitous that using anything else is impractical.
Many older adults who now use smartphones adopted not because they were excited about mobile computing but because pay phones disappeared, paper maps became unavailable, family members communicated exclusively through text and video calls, and basic social participation increasingly required smartphone access.
The late majority's adoption is driven more by the costs of non-adoption than by the benefits of adoption.
Laggards (16%) are the last to adopt, if they adopt at all. They tend to be tradition-oriented, suspicious of change, and socially isolated from the innovation's early proponents. Some laggards never adopt: there are still people who do not own smartphones, do not use the internet, and pay exclusively with cash.
Their non-adoption may reflect rational calculation (the technology genuinely does not serve their needs), resource constraints (they cannot afford the technology or the learning curve), or philosophical objection (they actively reject the values or consequences associated with the technology).
Five Characteristics That Determine Adoption Speed
Rogers identified five characteristics of innovations that consistently predict how quickly they will be adopted. These characteristics operate independently of the specific technology and apply equally to agricultural innovations, medical practices, consumer electronics, and organizational processes.
Relative advantage is the degree to which the innovation is perceived as superior to the practice it replaces. This is the single most important predictor of adoption speed. Technologies with clear, dramatic advantages over existing alternatives spread faster than those with marginal improvements.
The smartphone's relative advantage over the feature phone was enormous and multidimensional (internet access, apps, GPS navigation, camera, email), which is why smartphone adoption was one of the fastest technology transitions in history.
By contrast, the Segway personal transporter offered a modest advantage in personal transportation speed but at an enormous cost premium, which is why it never achieved mass adoption.
Crucially, relative advantage is perceived, not objective. A technology that is objectively superior but whose advantages are difficult to communicate or demonstrate will adopt slowly.
Conversely, a technology that offers modest objective improvement but is perceived as dramatically better (often through effective marketing, visible social proof, or cultural cachet) may adopt quickly.
Apple's products have historically exemplified this dynamic: while frequently not the most technically advanced in their category, they have been perceived as offering superior user experience, which has driven rapid adoption.
Compatibility is the degree to which the innovation fits with existing values, practices, and infrastructure. Technologies that require users to change their behavior dramatically adopt more slowly than those that fit seamlessly into existing routines.
Email adopted rapidly in business contexts because it was compatible with existing communication practices: it was essentially a faster, more flexible version of the interoffice memo.
By contrast, video conferencing was available for decades before achieving widespread adoption because it was incompatible with existing meeting practices, which relied on physical presence and informal side conversations that video could not replicate.
Only when the COVID-19 pandemic forced the issue in 2020 did video conferencing achieve rapid mainstream adoption, demonstrating that even incompatible technologies can diffuse rapidly when external circumstances eliminate the alternative.
Complexity is the degree to which the innovation is difficult to understand and use. Complex technologies adopt more slowly than simple ones, all else being equal. The graphical user interface (GUI) accelerated personal computer adoption precisely because it reduced the complexity barrier.
Before the GUI, using a computer required memorizing text commands, a skill most people were not willing to acquire. The mouse-and-windows interface made computers accessible to non-technical users, dramatically expanding the potential adopter population.
Trialability is the degree to which the innovation can be experimented with on a limited basis. Technologies that can be tried before committing to full adoption spread faster. Free trials, freemium models, and money-back guarantees all reduce the risk of adoption by increasing trialability.
The software-as-a-service (SaaS) model accelerated enterprise software adoption partly by replacing large upfront licensing costs with monthly subscriptions that could be cancelled, effectively converting a major commitment into a low-risk trial.
Observability is the degree to which the results of adopting the innovation are visible to potential adopters. Technologies whose benefits are publicly visible spread faster than those whose benefits are private and invisible.
The iPhone's success was partly attributable to its high observability: when someone used an iPhone in public, everyone around them could see the device and its distinctive interface, creating free advertising and social proof with every use.
By contrast, back-end infrastructure technologies like database systems have low observability because their benefits are invisible to everyone except the technical team that operates them, which partly explains why enterprise technology adoption is typically slower than consumer technology adoption.
| Characteristic | High Adoption Speed | Low Adoption Speed |
|---|---|---|
| Relative advantage | Electric light vs. candles | Segway vs. walking |
| Compatibility | Email vs. postal mail | Metric system in the US |
| Complexity | Google search vs. library research | Early Linux vs. Windows |
| Trialability | SaaS free trial | Enterprise ERP system |
| Observability | iPhone in public | Server-side software |
Crossing the Chasm: The Most Dangerous Phase of Technology Adoption
While Rogers's model describes the overall pattern of diffusion, it does not adequately address a critical discontinuity in the adoption process that has destroyed countless promising technologies and the companies that created them.
This discontinuity, located between the early adopters and the early majority, was most influentially described by Geoffrey Moore in his 1991 book Crossing the Chasm.
"The fundamental problem is the slippage between what delights early adopters and what satisfies the early majority." - Geoffrey A. Moore
Why the Chasm Exists
The chasm exists because early adopters and the early majority have fundamentally different motivations, risk tolerances, and evaluation criteria. Early adopters adopt technology for strategic advantage; they are willing to tolerate imperfection, invest in customization, and serve as unpaid beta testers.
The early majority adopts technology for practical problem-solving; they want proven, complete, well-supported products that work reliably out of the box.
The strategies that attract early adopters, emphasizing revolutionary potential, first-mover advantage, and disruptive capability, actively repel the early majority, who hear "revolutionary" and think "unproven," hear "first-mover" and think "guinea pig," and hear "disruptive" and think "risky." This mismatch means that success with early adopters does not automatically lead to success with the early majority.
Companies must deliberately change their positioning, messaging, product features, and go-to-market strategy to cross the chasm.
The chasm has claimed many casualties. Early personal digital assistants (PDAs) like the Apple Newton (1993) achieved enthusiastic early adopter reception but failed to cross the chasm because they were too limited and unreliable for mainstream use.
Google Glass (2013) attracted enormous early adopter interest but failed to cross the chasm partly because it was incompatible with mainstream social norms around privacy.
Numerous enterprise software startups have found passionate early adopter customers who love their product, only to discover that the early majority requires a completely different product with different features, different pricing, different support, and different sales processes.
Strategies for Crossing the Chasm
Moore's primary prescription for crossing the chasm is the bowling pin strategy: target a specific, narrow market segment (a "beachhead") where the technology solves a critical, urgent problem, achieve dominant market position in that segment, and then use that success as a reference point for expanding into adjacent segments.
This strategy works because it addresses the early majority's primary requirement: social proof from peers in their specific context. The early majority does not care that a technology works well for a completely different type of user in a completely different industry.
They want evidence that it works for people like them, solving problems like theirs, in conditions like theirs.
By concentrating resources on a narrow beachhead, a technology company can provide this specific social proof and build the complete product (including support, documentation, integration, training, and ecosystem) that the early majority demands.
Salesforce.com provides one of the best examples of successful chasm-crossing in the enterprise software industry. Salesforce launched in 1999 as a cloud-based customer relationship management (CRM) tool.
Its initial beachhead was small sales teams at technology companies who were frustrated with the complexity and cost of traditional on-premise CRM software like Siebel Systems.
By dominating this narrow segment and building a comprehensive platform around it (AppExchange, extensive integrations, a large consultant ecosystem), Salesforce was able to expand systematically into larger companies, different industries, and eventually the broader enterprise software market.
By 2024, Salesforce had over $34 billion in annual revenue, dwarfing the traditional CRM vendors it once challenged.
Network Effects: When Adoption Accelerates Itself
Network effects occur when the value of a technology to each user increases as more users adopt it.
Network effects create powerful positive feedback loops that can accelerate adoption dramatically once a critical threshold of users is reached, but they can also create barriers that prevent new technologies from displacing established ones.
Direct and Indirect Network Effects
Direct network effects occur when users directly benefit from other users' adoption. The telephone is the classic example: a telephone is useless if only one person owns one, marginally useful if a few people own one, and increasingly valuable as more people join the network.
Social media platforms exhibit strong direct network effects: Facebook, LinkedIn, and WhatsApp are valuable primarily because your friends, colleagues, and contacts are on them.
Direct network effects tend to produce winner-take-all markets because the largest network provides the most value, which attracts the most new users, which further increases its value.
Indirect network effects (also called cross-side network effects) occur when one group of users benefits from the adoption of a different group of users.
Smartphone platforms exhibit strong indirect network effects: the more consumers use iPhones, the more attractive the iOS platform becomes to app developers, and the more apps available on iOS, the more attractive iPhones become to consumers.
Payment networks exhibit similar dynamics: the more merchants accept Visa, the more attractive Visa becomes to consumers, and the more consumers carry Visa, the more attractive it becomes to merchants.
Tipping Points and Lock-In
Network effects create tipping points, threshold levels of adoption beyond which the technology becomes essentially self-reinforcing. Below the tipping point, adoption may stall or reverse because the network is not yet valuable enough to attract and retain users.
Above the tipping point, adoption accelerates because each new user makes the network more valuable, attracting more users in a virtuous cycle.
The concept of the tipping point was formalized by economist W. Brian Arthur in his work on increasing returns, which showed that technologies subject to network effects and learning-by-doing economies tend toward monopoly or oligopoly outcomes.
Once a technology crosses the tipping point and achieves dominance, it becomes extremely difficult for competitors to displace it, even if the competing technology is objectively superior. This is the phenomenon of technology lock-in.
The QWERTY keyboard layout is the most frequently cited example of technology lock-in, though economists debate whether QWERTY is genuinely inferior to alternatives like the Dvorak layout.
More convincing examples include the VHS-Betamax format war of the 1980s (VHS won despite Betamax's technical superiority because VHS achieved a larger installed base of users and content faster), the Windows-Macintosh competition of the 1990s (Windows achieved dominant market share through OEM partnerships that gave it a larger installed base, which attracted more software developers, which further increased its advantage), and the current dominance of Google Search (Google's search quality is partly a product of its dominant market share, because more users provide more data, which trains better algorithms, which attract more users).
Breaking Network Effect Lock-In
Despite the power of network effects, established technologies do get displaced by new ones. Understanding how this happens is crucial for both challengers and incumbents.
Disruptive innovation is one pathway, described by Clayton Christensen in The Innovator's Dilemma. Disruptive technologies initially serve a different market segment (often a lower-end or new-market segment) that the incumbent ignores.
The disruptive technology then improves over time until it meets the needs of the incumbent's mainstream customers, at which point adoption shifts rapidly.
Personal computers disrupted minicomputers this way, digital photography disrupted film photography, and streaming video is disrupting cable television.
Platform migration can occur when a new technology platform provides a compelling reason for an entire ecosystem to shift simultaneously.
The transition from desktop to mobile computing happened relatively quickly because the smartphone offered entirely new capabilities (location awareness, always-on connectivity, camera integration) that could not be replicated on desktop platforms, providing strong enough advantages to motivate the massive switching costs involved.
Multi-homing reduces the power of network effects by allowing users to participate in multiple networks simultaneously. When users can easily be on both Facebook and Instagram, or use both Uber and Lyft, or switch between Slack and Microsoft Teams, the lock-in effect of any single network is weakened.
Multi-homing is more feasible for some types of networks than others: it is easy to use multiple social media platforms but difficult to use multiple mobile operating systems.
Why People Resist New Technology
Technology resistance is not irrational, a point that technology enthusiasts and innovation advocates frequently fail to appreciate. People resist new technology for a variety of reasons, many of which reflect legitimate concerns and rational calculations rather than ignorance or technophobia.
"People don't resist change. They resist being changed." - Peter Senge
Switching Costs
Switching costs include every expense, whether financial, temporal, cognitive, or emotional, involved in transitioning from an existing technology to a new one. Financial switching costs include the price of the new technology and the write-off of the old.
Temporal switching costs include the time required to learn the new technology and rebuild workflows around it. Cognitive switching costs include the mental effort of mastering new interfaces, procedures, and mental models. Emotional switching costs include the loss of familiarity, comfort, and identity associated with the old technology.
Switching costs are often dramatically underestimated by technology advocates who are themselves early adopters with high tolerance for disruption. For the early majority and late majority, switching costs loom large.
An accounting firm whose entire workflow is built around a particular software package faces enormous switching costs in transitioning to a different package, regardless of the new package's technical superiority.
The switching costs include not just the software itself but retraining staff, converting data, rebuilding customizations, disrupting client relationships during the transition, and accepting a temporary productivity decline while everyone climbs the learning curve.
Legitimate Concerns About Downsides
Technology adoption invariably involves trade-offs, and people who resist adoption may be rationally evaluating trade-offs that enthusiasts are ignoring or dismissing. Workers who resist automation may be accurately perceiving that the technology threatens their livelihoods.
Parents who resist giving smartphones to children may be rationally weighing the documented effects of social media on adolescent mental health. Communities that resist the deployment of facial recognition technology may be legitimately concerned about privacy, surveillance, and the potential for abuse.
The history of technology is filled with examples where early resistance proved prescient. Early critics of social media who warned about addiction, misinformation, and mental health effects were dismissed as Luddites but proved substantially correct.
Critics of "move fast and break things" approaches to technology deployment warned about the consequences of deploying powerful technologies without adequate safety measures, warnings that subsequent events validated repeatedly.
The Innovation Bias
Technology advocates and the media share an innovation bias, a systematic tendency to overestimate the benefits and underestimate the costs of new technologies.
This bias leads to the hype cycle described by the Gartner consulting firm: new technologies are initially greeted with inflated expectations (the "Peak of Inflated Expectations"), followed by disappointment when they fail to deliver on hype (the "Trough of Disillusionment"), followed by gradual realistic adoption as the technology finds its genuine use cases (the "Slope of Enlightenment") and eventually reaches productive mainstream use (the "Plateau of Productivity").
The hype cycle has been remarkably consistent across technologies. Artificial intelligence has gone through multiple hype cycles since the 1960s, with periods of inflated expectations followed by "AI winters" of disillusionment, followed by renewed (and more realistic) enthusiasm.
Virtual reality followed the same pattern: hyped in the early 1990s, disillusioning through the 2000s, revived with more realistic expectations in the 2010s, and still searching for its mainstream use case.
Blockchain technology went through a compressed hype cycle from 2016 to 2019, with cryptocurrency speculation driving inflated expectations that were followed by the "crypto winter" of 2019 and subsequent more measured adoption of blockchain for specific enterprise use cases.
Technology Adoption in Organizations
Organizational technology adoption follows the same broad patterns as individual adoption but with additional complexity arising from the need to coordinate adoption across many individuals, align new technology with existing processes and power structures, and manage the organizational change that technology adoption inevitably requires.
The Technology-Organization-Environment Framework
Researchers Louis Tornatzky and Mitchell Fleischer proposed the TOE (Technology-Organization-Environment) framework in 1990, identifying three contexts that influence organizational technology adoption.
The technology context includes the characteristics of the innovation itself (relative advantage, compatibility, complexity, trialability, observability) as well as the characteristics of available technologies that are not yet adopted.
Organizations are more likely to adopt new technologies when they perceive high relative advantage, low complexity, and high compatibility with existing systems.
The organizational context includes the firm's size, scope, managerial structure, communication processes, and amount of slack resources. Larger organizations often have more resources for technology investment but face greater coordination challenges in implementation.
Research consistently shows that organizations with more centralized decision-making adopt new technologies faster (because approval requires fewer steps) but implement them more poorly (because centralized decisions fail to account for local conditions and generate less buy-in).
The environmental context includes industry characteristics, market structure, regulatory environment, and competitive pressure.
Organizations are more likely to adopt new technologies when competitors have already adopted them (competitive pressure), when industry norms favor innovation (industry culture), when regulations mandate or incentivize adoption (regulatory push), and when technology vendors actively market to them (supply push).
The Implementation Gap
One of the most consistent findings in organizational technology research is the implementation gap, the difference between technology adoption (the decision to acquire and deploy a technology) and technology assimilation (the actual integration of the technology into organizational routines and practices).
Many organizations adopt new technologies without successfully assimilating them, resulting in expensive software that nobody uses, sophisticated equipment that operates at a fraction of its capacity, and digital transformation initiatives that produce digital tools but no actual transformation.
Research by Michael Gallivan at Georgia State University found that even after organizations officially adopt new technologies, individual employees often resist, work around, or superficially comply with the new systems without genuinely changing their work practices.
A classic study by Wanda Orlikowski at MIT found that organizations that deployed Lotus Notes, a groundbreaking collaborative software platform, often used it merely as an email system, failing to adopt the collaborative features that represented the technology's real value.
The technology was adopted but its transformative potential was never realized.
Closing the implementation gap requires organizational change management that addresses not just the technical aspects of deployment but the human aspects:
"An organization's ability to learn, and translate that learning into action rapidly, is the ultimate competitive advantage." - Jack Welch
Training, incentive realignment, process redesign, management support, and cultural change are all essential. Research consistently shows that organizations spend disproportionately on technology acquisition and disproportionately little on the organizational changes needed to realize the technology's value.
The ratio is often cited as 80/20: 80% of the effort and expense needed for successful technology adoption involves organizational change, while only 20% involves the technology itself.
Predicting Technology Success: What We Can and Cannot Know
Can we predict which technologies will succeed? The honest answer is: partially. We can identify characteristics that make success more or less likely, but unpredictable factors make definitive prediction impossible.
What We Can Predict
Rogers's five characteristics (relative advantage, compatibility, complexity, trialability, observability) provide a reasonable first-pass assessment of a technology's adoption potential.
Technologies that score high on all five characteristics are highly likely to achieve at least some adoption, while technologies that score low on multiple characteristics face severe headwinds.
Market structure provides additional predictive power. Technologies entering markets with strong network effects face a chicken-and-egg problem that makes success much harder to predict. Technologies entering markets without network effects can be evaluated more straightforwardly on their individual merits.
The characteristics of the potential adopter population matter as well. Technologies targeting populations with high technical literacy, high risk tolerance, and strong peer networks are more likely to achieve rapid initial adoption.
Technologies targeting populations with low technical literacy, high risk aversion, and fragmented social networks face slower and more uncertain adoption trajectories.
What We Cannot Predict
Timing is perhaps the most unpredictable factor in technology adoption. The same technology can fail at one time and succeed at another, sometimes separated by decades. Tablet computers failed in the early 2000s (Microsoft Tablet PC, various tablet prototypes) but succeeded spectacularly in 2010 (iPad).
The difference was not primarily in the technology itself but in the ecosystem conditions (faster processors, better touchscreens, app stores, wireless connectivity, cloud services) that made the same basic concept viable a decade later.
Competing innovations introduce fundamental uncertainty. A technology may have excellent intrinsic characteristics for adoption, but if a superior alternative emerges before it achieves critical mass, it can be displaced before reaching its potential.
The smartphone killed the PDA, the tablet, the MP3 player, the point-and-shoot camera, and the portable GPS navigator, not because these technologies were bad but because the smartphone provided "good enough" versions of all of them in a single device.
Black swan events can dramatically alter technology trajectories. The COVID-19 pandemic compressed years of video conferencing, remote work technology, telemedicine, and e-commerce adoption into months. The 9/11 attacks accelerated surveillance technology adoption across governments worldwide.
Financial crises can kill technologies that were on the verge of crossing the chasm by eliminating the investment capital and consumer spending they needed to survive the critical transition period.
Social and political dynamics can promote or prevent technology adoption in ways that are difficult to predict from the technology's intrinsic characteristics alone.
Genetically modified foods have high relative advantage by many objective measures but have been largely rejected in Europe due to social and political opposition that has little to do with the technology's technical characteristics.
Nuclear power was widely adopted in France but largely rejected in Germany, despite identical underlying technology, because of differences in political culture and public opinion shaped by historical events.
Historical Patterns and Lessons
Looking across the full sweep of technology adoption history, several broad patterns emerge that transcend any individual technology or era.
The pace of adoption has generally accelerated over time. Landline telephones took approximately 75 years to reach 50% of American households (1876 to roughly 1950). Television took about 15 years (1948 to roughly 1963). The World Wide Web took about 10 years (1993 to roughly 2003).
Smartphones took about 8 years (2007 to roughly 2015). This acceleration reflects multiple factors: faster communication channels that speed awareness, globalized supply chains that speed availability, software-based technologies that can be updated and improved continuously, and a population increasingly experienced with technology adoption.
Adoption is rarely uniform across demographic and geographic lines. The "digital divide" describes the gap in technology access between wealthy and poor, urban and rural, young and old, educated and less-educated populations.
This divide has persisted across successive waves of technology adoption, though its specific dimensions change.
In the 1990s, the divide was about computer and internet access. In the 2010s, it shifted to broadband quality and smartphone capability.
In the 2020s, it increasingly involves the ability to effectively use digital tools for education, work, and civic participation, a divide sometimes called the "second digital divide" or "digital use divide."
Incumbent technologies rarely die quickly. Radio survived television. Television survived the internet. Print books survived e-books. Email survived social media.
Incumbent technologies that have achieved widespread adoption and deep integration into social practices tend to persist alongside their successors for decades or even indefinitely, often finding niche roles that exploit their specific advantages.
Vinyl records, declared dead multiple times, have experienced a sustained revival because they offer experiential qualities (warmth of analog sound, large album artwork, the ritual of playing a record) that digital formats lack. The complete displacement of an incumbent technology is the exception, not the rule.
Unintended consequences are the rule, not the exception. The automobile was intended to solve the problems of horse-drawn transportation (slow speed, manure, limited range).
It did solve those problems but also created new ones (traffic fatalities, air pollution, urban sprawl, oil dependency, suburban isolation) that were largely unforeseen.
Social media was intended to connect people and democratize information. It did both things but also created new problems (misinformation, polarization, mental health effects, attention addiction, privacy erosion) that were largely unforeseen.
The pattern is so consistent that any technology adoption analysis should include explicit consideration of potential unintended consequences, not as speculation but as a virtual certainty that the specific form of the consequences will surprise us even if their existence does not.
Technology Adoption and the Future
The dynamics of technology adoption continue to evolve as the technologies themselves become more complex, more interconnected, and more deeply embedded in social life. Several emerging trends are worth noting.
The increasing role of artificial intelligence in adoption decisions. Recommendation algorithms on platforms like Amazon, YouTube, and TikTok now play a significant role in determining which technologies users are exposed to and adopt.
AI-driven personalization means that different users are presented with different technology options, potentially creating more fragmented and less predictable adoption patterns than those described by traditional diffusion models.
The growing importance of platform ecosystems. Individual technologies increasingly exist within larger platform ecosystems (Apple, Google, Amazon, Microsoft), and adoption decisions are increasingly about choosing ecosystems rather than individual products.
This fundamentally changes the dynamics of adoption because users face enormous switching costs not for individual technologies but for entire interconnected systems of technologies, data, and services.
The acceleration of technology cycles. The pace at which new technologies emerge, achieve adoption, and are superseded continues to accelerate, creating a kind of adoption fatigue in which both individuals and organizations face a constant stream of adoption decisions with insufficient time to fully realize the value of each technology before the next one demands attention.
This acceleration may be reaching limits imposed by human cognitive capacity, organizational change capacity, and the physical infrastructure needed to support new technologies.
Understanding how technology adoption works does not eliminate the uncertainty inherent in the process. But it provides a framework for thinking systematically about which factors matter, which dynamics are at play, and which strategies are most likely to succeed in bringing new technologies from invention to widespread use.
The patterns are clear enough to be genuinely useful, while the inherent unpredictability keeps the process endlessly fascinating.
Sources & Further Reading
Rogers, E. M. (2003). Diffusion of Innovations (5th ed.). Free Press. View source
Moore, G. A. (2014). Crossing the Chasm: Marketing and Selling Disruptive Products to Mainstream Customers (3rd ed.). Harper Business. View source
Christensen, C. M. (2016). The Innovator's Dilemma: When New Technologies Cause Great Firms to Fail. Harvard Business Review Press. View source
Arthur, W. B. (1994). Increasing Returns and Path Dependence in the Economy. University of Michigan Press. View source
Davis, F. D. (1989). Perceived usefulness, perceived ease of use, and user acceptance of information technology. MIS Quarterly, 13(3), 319-340. DOI: 10.2307/249008
Tornatzky, L. G. & Fleischer, M. (1990). The Processes of Technological Innovation. Lexington Books. View source
Shapiro, C. & Varian, H. R. (1999). Information Rules: A Strategic Guide to the Network Economy. Harvard Business School Press. View source
Orlikowski, W. J. (2000). Using technology and constituting structures: A practice lens for studying technology in organizations. Organization Science, 11(4), 404-428. DOI: 10.1287/orsc.11.4.404.14600
Venkatesh, V., Morris, M. G., Davis, G. B., & Davis, F. D. (2003). User acceptance of information technology: Toward a unified view. MIS Quarterly, 27(3), 425-478. DOI: 10.2307/30036540
Gartner. (n.d.). Hype Cycle Research Methodology. View source
Gallivan, M. J. (2001). Organizational adoption and assimilation of complex technological innovations. The DATA BASE for Advances in Information Systems, 32(3), 51-85. DOI: 10.1145/506724.506729
Bass, F. M. (1969). A new product growth for model consumer durables. Management Science, 15(5), 215-227. DOI: 10.1287/mnsc.15.5.215
Perez, C. (2002). Technological Revolutions and Financial Capital: The Dynamics of Bubbles and Golden Ages. Edward Elgar Publishing.
Fichman, R. G. (2004). Going beyond the dominant paradigm for information technology innovation research. Journal of the Association for Information Systems, 5(8), 314-355. View source
Zuboff, S. (2019). The Age of Surveillance Capitalism. PublicAffairs. View source
Notes
- Rogers, E. M. "Diffusion of Innovations." Free Press, 2003.
- Moore, G. A. "Crossing the Chasm: Marketing and Selling Disruptive Products to Mainstream Customers." Harper Business, 1991.
- Christensen, C. M. "The Innovator's Dilemma: When New Technologies Cause Great Firms to Fail." Harvard Business Review Press, 1997.
- Arthur, W. B. "Competing Technologies, Increasing Returns, and Lock-In by Historical Events." The Economic Journal, 1989.
- Bass, F. M. "A New Product Growth Model for Consumer Durables." Management Science, 1969.
- Gartner Research. "Understanding Gartner's Hype Cycles." Gartner, 2023.
- Orlikowski, W. J. "The Duality of Technology: Rethinking the Concept of Technology in Organizations." Organization Science, 1992.
- Perez, C. "Technological Revolutions and Financial Capital: The Dynamics of Bubbles and Golden Ages." Edward Elgar Publishing, 2002.
- Shapiro, C. & Varian, H. R. "Information Rules: A Strategic Guide to the Network Economy." Harvard Business School Press, 1999.
- Senge, P. M. "The Fifth Discipline: The Art and Practice of the Learning Organization." Doubleday, 1990.
Researchers Who Built the Science of Technology Diffusion
Technology adoption research has accumulated an empirical foundation over six decades, moving from Rogers's early sociological studies through formal economic modeling to contemporary network science that can trace adoption dynamics at the individual level.
Everett Rogers (1931-2004) was a communication scholar who synthesized findings from thousands of adoption studies conducted across agriculture, medicine, public health, and technology into a unified theoretical framework.
Rogers's Diffusion of Innovations, first published in 1962 and now in its fifth edition (2003), remains one of the most cited works in the social sciences, with over 100,000 scholarly citations.
Rogers originally identified the five characteristics predicting adoption speed (relative advantage, compatibility, complexity, trialability, observability) through meta-analysis of 508 diffusion studies, and subsequent research across hundreds more studies has consistently confirmed their predictive validity.
Rogers also documented the "re-invention" phenomenon, the tendency for adopters to modify innovations as they adopt them, challenging the assumption that technologies diffuse unchanged from inventor to user.
His research on family planning adoption in Colombia, Peru, and South Korea found that re-invention correlated positively with sustained adoption, meaning adopters who modified programs to fit local conditions were more likely to maintain them than those who adopted wholesale.
This finding has influenced international development practice, with organizations including USAID and the Bill and Melinda Gates Foundation designing "flexible fidelity" implementation protocols that specify core components while allowing local adaptation of peripheral elements.
Geoffrey Moore (born 1946) is a management theorist and venture capitalist whose work identifying the chasm between early adopters and the early majority transformed how technology companies approach market strategy.
Moore's 1991 book Crossing the Chasm drew on his experience advising Silicon Valley companies as a partner at Regis McKenna Inc.
to identify why so many technically successful innovations failed commercially. The "bowling pin" strategy Moore prescribed, targeting a narrow initial market segment before expanding, has been tested across dozens of technology sectors.
Research by INSEAD professor Mohanbir Sawhney examined 100 technology company case studies and found that companies following a focused beachhead strategy were 3.4 times more likely to achieve sustained mainstream adoption than those pursuing broad market strategies from launch.
Moore's framework influenced the go-to-market strategies of companies including Salesforce (initial focus on sales teams at technology companies), HubSpot (initial focus on small businesses under 10 employees), and Slack (initial focus on engineering teams at technology companies), all of which used focused beachhead penetration before expanding to broader markets.
Frank Bass (1926-2006) was a marketing scientist at Purdue University and later the University of Texas at Dallas who developed the Bass Diffusion Model, the most widely used quantitative framework for forecasting technology adoption.
Published in 1969 in Management Science, the model predicts adoption timing using just two parameters: the coefficient of innovation (the probability that a non-adopter is influenced by advertising and other external communications) and the coefficient of imitation (the probability that a non-adopter is influenced by word-of-mouth from existing adopters).
The model has been validated across hundreds of products and technologies: a 2004 meta-analysis by Peres, Muller, and Mahajan found that the Bass model outperformed more complex models in predictive accuracy for 80% of technologies studied.
The model's elegant separation of external influence (advertising) from internal influence (word-of-mouth) has practical implications: it predicts that word-of-mouth dominates adoption dynamics once a technology reaches approximately 15-20% market penetration, meaning marketing investments that accelerate early adoption have outsized impact on total diffusion speed.
Gartner's Hype Cycle methodology, used by technology analysts and corporate technology planners worldwide, is a direct descendant of Bass's insights, adapted to incorporate the disillusionment dynamics that emerge when adoption expectations exceed early capabilities.
Historical Case Studies in Technology Adoption With Measurable Outcomes
Specific technology adoption histories provide concrete evidence for the theoretical mechanisms identified by diffusion researchers, and in several cases have directly shaped subsequent adoption policy and strategy.
Mobile Banking Adoption in Kenya: M-Pesa (2007-2015). Safaricom launched M-Pesa, a mobile phone-based money transfer service, in Kenya in 2007. By 2015, approximately 75% of Kenyan adults had used M-Pesa, making it the fastest adoption of a financial service in any country in recorded history.
MIT economists Tavneet Suri and William Jack conducted a longitudinal study of M-Pesa adoption and its effects, published in Science in 2016 with a sample of 1,525 households surveyed across five years.
The study found that access to M-Pesa increased household consumption levels and lifted approximately 194,000 households, or 2% of Kenyan households, out of extreme poverty, with effects concentrated among female-headed households.
The mechanism was primarily financial resilience: M-Pesa users were better able to manage income shocks (illness, crop failure, job loss) by receiving transfers from family members, increasing consumption smoothing.
The adoption speed reflected M-Pesa's exceptionally high scores on Rogers's five characteristics: relative advantage (replacing informal money transfer by bus courier, which was slow, unreliable, and expensive), compatibility (using existing mobile phones on the dominant Safaricom network), low complexity (a simple four-step USSD menu), trialability (free to receive, low-cost to send), and high observability (the service was visible to entire communities as users received and sent money publicly).
M-Pesa's success has been replicated in Tanzania, Rwanda, and South Africa, while attempts to replicate it in India and South Africa initially failed due to lower compatibility with existing mobile infrastructure and regulatory barriers, demonstrating that adoption speed is context-dependent even for technologies with excellent intrinsic characteristics.
Electronic Medical Records in the United States (2009-2019). The Health Information Technology for Economic and Clinical Health (HITECH) Act of 2009 committed $27 billion in financial incentives to accelerate adoption of electronic health records (EHRs) among hospitals and physicians.
Before HITECH, approximately 10% of US hospitals used comprehensive EHR systems; by 2017, adoption exceeded 96%. The program provides one of the most extensively studied cases of incentive-driven technology adoption in any sector.
A 2012 study by researchers at Harvard Medical School, published in Health Affairs, found that each $1,000 increase in EHR incentive payments was associated with a 0.7 percentage point increase in the probability of adoption among eligible hospitals, demonstrating a measurable price elasticity of technology adoption.
However, research also documented the implementation gap: a 2013 survey by the American Hospital Association found that while 96% of hospitals had adopted certified EHR systems, only 44% demonstrated "meaningful use" at Stage 2, the level required for interoperability and clinical decision support functions that produce measurable patient outcomes.
Research by Julia Adler-Milstein at UCSF and colleagues found that hospitals serving higher proportions of Medicaid patients were significantly less likely to achieve meaningful use despite equivalent adoption rates, illustrating how demographic and organizational factors shape the gap between adoption and assimilation.
The Smartphone Camera and the Decline of Standalone Cameras (2007-2015). The smartphone camera's displacement of the standalone point-and-shoot camera market provides a near-perfect empirical case for Clayton Christensen's disruptive innovation theory.
Smartphone cameras were clearly inferior to standalone cameras on objective technical measures (image quality, zoom capability, low-light performance) when the iPhone launched in 2007.
Yet standalone camera unit sales peaked at approximately 110 million units globally in 2008 and fell to under 15 million by 2015, a 86% decline over seven years.
Research by Willy Shih at Harvard Business School, published as a series of case studies from 2012 to 2016, documented the specific mechanism: smartphone cameras attacked the standalone camera market from the bottom, addressing the "good enough" use cases (social sharing, quick documentation, casual photography) that represented the vast majority of point-and-shoot usage, while the remaining professional and enthusiast use cases moved to mirrorless and DSLR cameras that smartphones could not displace.
Kodak, Fujifilm, Casio, and Olympus exited the point-and-shoot market entirely by 2013-2016. Fujifilm survived by pivoting aggressively to medical imaging and specialty film products; Kodak did not.
The case is regularly cited in business school courses as evidence that disruptive innovation operates through good-enough performance in underserved use cases, not through head-to-head technical competition with incumbents.
Frequently Asked Questions
How do technologies get adopted?
Through diffusion process, innovators to early adopters to early/late majority to laggards. S-curve pattern of gradual then rapid then slow adoption.
What determines adoption speed?
Relative advantage, compatibility with existing practices, complexity, trialability, and observability of benefits.
Why do some technologies fail to spread?
Insufficient advantage over existing, too complex, incompatible with values/practices, or better alternatives emerge.
What's the technology adoption curve?
S-curve showing adoption stages, innovators (2.5%), early adopters (13.5%), early majority (34%), late majority (34%), laggards (16%).
What's the chasm in technology adoption?
Gap between early adopters and early majority, different motivations mean strategies working for early adopters fail for mainstream.
How does network effects affect adoption?
Value increases with users, creates tipping points where adoption accelerates rapidly once critical mass reached.
Can you predict which technologies will succeed?
Partially, can identify favorable characteristics but unpredictable factors (timing, alternatives, events) affect outcomes.
Why do people resist new technology?
Switching costs, uncertainty, satisfaction with current solution, incompatibility with workflow, or legitimate concerns about downsides.